A real image is much more complex than the six-pixel example, but the general principles remain the same. Several minor differences are immediately apparent, however.
- In MR imaging we typically use at least 256 divisions along the frequency-encode axis, and thus the first FT spectrum will have 256+ frequency "bars" rather than 3.
- The number of echo signals acquired equals the number of phase encode steps, which is usually 192 or 256 rather than 2.
- The phase shifts between the rows are not simple multiples of 180°, but vary from echo to echo depending on the size of the phase-encoding step.
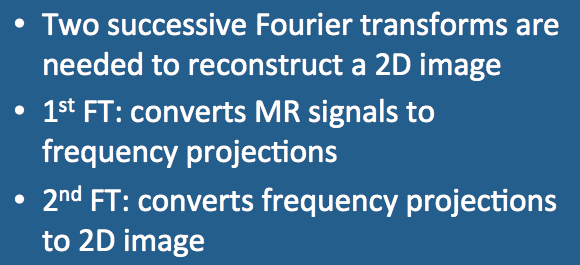
- Because each echo has been acquired using a different set of inter-row phase shifts, the spectral amplitudes (heights of the bars) for each echo cannot simply be added or subtracted to compute individual pixel values as before. In order to sort out where each signal in a frequency column has originated, a second FT must be performed.
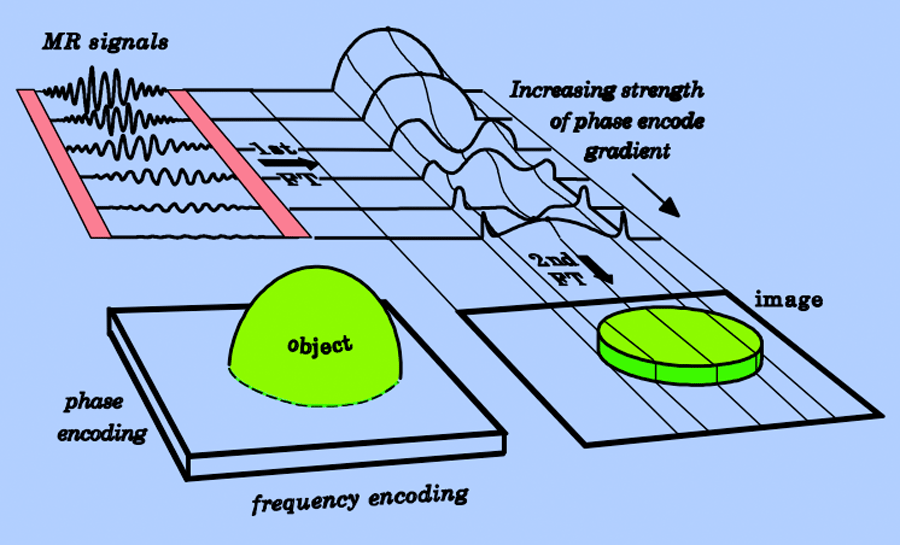
This 2DFT encoding and reconstruction process is illustrated below, where multiple phase-encode steps generate an array of different MR signals from a slice through a spherical phantom. The first Fourier transformation of each of these signals provides a crude frequency-projection of the object, modified by the phase shifts imparted by each step. Note that for low order phase-encodings, the MR signal is strong. The frequency projection approximates the general shape of the object but lacks edge definition. The higher order phase encode steps have smaller MR signals but provide more information about spatial detail, such as the location of edges.
To construct the final image, a second Fourier transform is performed using data from this intermediate stage grouped into columns of the same frequency. Note that in our example, the data in each of these columns has the form of a decaying oscillation reminiscent of a sinc function. Indeed, this is the case, because the final projection of the object along each line in the phase encode direction is in the form of a rectangle.
To construct the final image, a second Fourier transform is performed using data from this intermediate stage grouped into columns of the same frequency. Note that in our example, the data in each of these columns has the form of a decaying oscillation reminiscent of a sinc function. Indeed, this is the case, because the final projection of the object along each line in the phase encode direction is in the form of a rectangle.
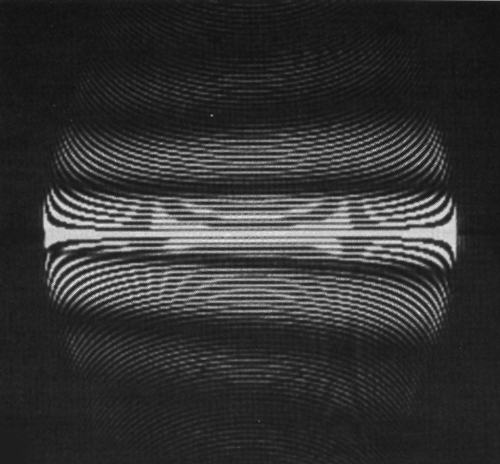
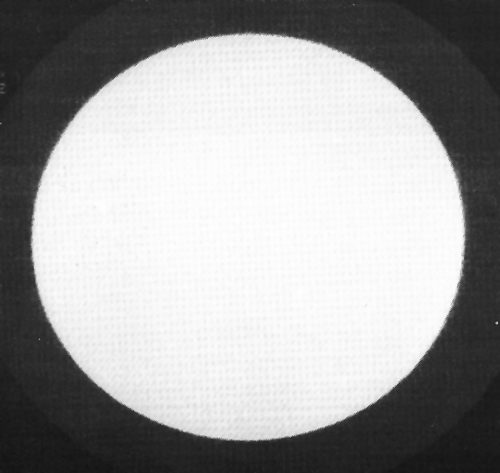
To reinforce to you that this process is "real", I have imaged a spherical phantom in my scanner and stopped image processing after the first Fourier transform has been performed. Here we see that the raw signal data has been converted into a crude frequency projection of the object's cross section. Along the horizontal (frequency encoding) axis we see the edges of the object; we are unsure at this stage what it looks like in its vertical extent. By performing Fourier transformation along each vertically oriented frequency column, we can reconstruct the final image which is a homogenous in signal and round in cross-section.
Advanced Discussion (show/hide)»
No supplementary material yet. Check back soon!
Related Questions
What is a Fourier transform?
I understand the 2-pixel example, but I still can't put it all together with the whole image and frequency encoding. Can you help?
What is a Fourier transform?
I understand the 2-pixel example, but I still can't put it all together with the whole image and frequency encoding. Can you help?


