|
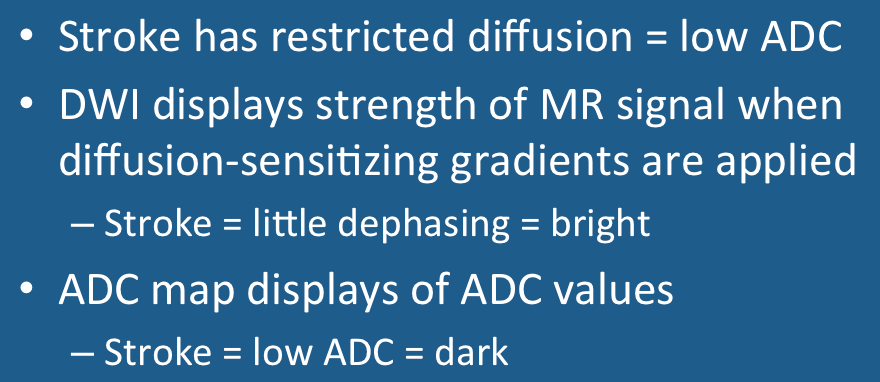
The pictured 2-day-old cerebral infarction illustrates the type of clinical scenario that might have given rise to the student's question. On the trace DW image (left) the stroke appears white, while on the ADC map (right) it appears dark. So why are the brightness levels opposite of one another?
|
This paradox can easily be resolved by considering how each data set is created and what each image represents. The only additional piece of knowledge required is that the area of infarction has restricted diffusion. In other words, the apparent diffusion coefficient (ADC) of the stroke is low compared to the rest of the brain and cerebrospinal fluid (CSF)
The trace DW image is a direct display of the averaged pixel-by-pixel signal intensities obtained while diffusion-sensitizing gradients are applied. Substances with high diffusivity (like CSF) dephase and lose signal during application of these gradients. Conversely, tissues with restricted diffusion (like infarctions) do not lose as much signal and appear bright.
The ADC image is a calculated parameter map that computes ADC values on a pixel-by-pixel basis using data from two or more raw data sets with different b-values. By convention, higher ADC values are displayed as white while lower ADC values are displayed as dark. Hence the infarcted area of brain with low ADC values will appear dark on the ADC map (while appearing white on the conventional DW image.
Advanced Discussion (show/hide)»
No supplementary material yet. Check back soon!
References
Minati L, Weglarz WP. Physical foundations, models, and methods of diffusion magnetic resonance imaging of the brain: a review. Concepts Magn Reson 2007; 30A:278-307.
Mukherjee P, Berman JI, Chung SW, et al. Diffusion tensor MR imaging and fiber tractography: theoretic underpinnings. AJNR Am J Neuroradiol 2008; 29:632-640.
Schaefer PW, Grant PE, Gonzalez RG. Diffusion-weighted MR imaging of the brain. Radiology 2000; 217:331-345.
Related Questions
How do you make a DW image?
What is the Trace DW image? How does it differ from the ADC map?
How do you make a DW image?
What is the Trace DW image? How does it differ from the ADC map?


