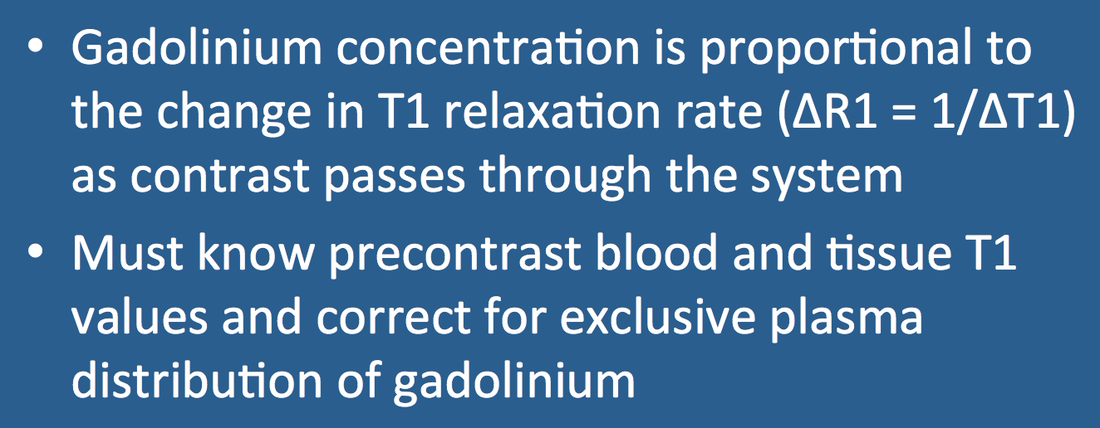
The first step toward full quantification of a DCE study is determining the concentration of tissue gadolinium [Gd] from the magnitude of the MR signal. The process is similar to that used for DSC imaging — that the change in T1-relaxation rate, ΔR1 (=1/ΔT1), is directly proportional to [Gd]. Note that this assumption is true only for dilute aqueous solutions of contrast and hence may not strictly apply to tissues where macromolecular interactions affect relaxivity and compartmentalization may alter the fast exchange of water.
The usual DCE pulse sequence is a spoiled gradient echo (FLASH/SPGR/T1-FFE) whose signal intensity (S) is given by
Here k is a scaling constant, [H] is spin density, and α is the RF flip angle. The relationship between signal intensity and T1 is not as straightforward as the simple logarithmic ratio described for DSC, but can still be determined. The precision of this calculation depends upon knowledge of the background tissue T1 without contrast. This value may be obtained by a separate precontrast calibration sequence (preferred) or estimated from population averages. Without this calibration only relative gadolinium concentrations can be determined from the MR signal.
Finally, because gadolinium-based contrast agents distribute in plasma rather than whole blood, their effective plasma concentrations must be considered. The ratio of plasma to whole blood depends on the hematocrit (Hct = % of red blood cells), giving the relationship: [Gd]blood = [Gd]plasma × (1−Hct). For a typical normal Hct = 40%, the gadolinium concentration is plasma is therefore approximately 1.7 times higher than that measured in whole blood.
Note that the hematocrit may vary in the same patient over time, especially in cancer patients undergoing chemotherapy. Changing Hct may thus significantly affect serial quantitive DCE measurements if adjustments are not made. Another factor not frequently considered in most DCE calculations is that Hct is a factor of 2 or more lower in capillaries (where gadolinium exchange occurs) than in larger arteries (Fåhraeus effect).
Note that the hematocrit may vary in the same patient over time, especially in cancer patients undergoing chemotherapy. Changing Hct may thus significantly affect serial quantitive DCE measurements if adjustments are not made. Another factor not frequently considered in most DCE calculations is that Hct is a factor of 2 or more lower in capillaries (where gadolinium exchange occurs) than in larger arteries (Fåhraeus effect).
Advanced Discussion (show/hide)»
In cardiac imaging and some other applications a saturation recovery (SR) sequence may be used for DCE instead of a spoiled GRE. In this case the signal intensity equation is given by
S = k [H] (1 − e−TD/T1) e−TE/T2*
where TD is the delay time between the 90°-pulse and acquisition.
References
Fåhraeus R, Lindqvist T. The viscosity of the blood in narrow capillary tubes. Am J Physiol 1931; 96:562-568. (Classic paper demonstrating what is now known as the "Fåhraeus effect" - that hematocrit decreases strongly with reduced vascular size below about 0.3 mm diameter. This is because blood viscosity decreases and RBCs move more quickly than plasma down the center of capillaries.)
Parker GJM, Barker GJ, Tofts PS. Accurate multislice gradient echo T1 measurement in the presence of non-ideal RF pulse shape and RF filed nonuniformity. Magn Reson Med 2001; 45:838-845.
Pries AR, Ley K, Gaehtgens P. Generalization of the Fåhraeus principle for microvessel networks. Am J Physiol 1986; 251:H1324-H1332.
Schabel MC, Parker DL. Uncertainty and bias in contrast concentration measurements using spoiled gradient echo pulse sequences. Phys Med Biol 2008; 53:2345-2373.
Tofts PS. T1-weighted DCE imaging concepts: modelling, acquisition and analysis. MAGNETOM Flash 2010; 3:30-35.
Zaharchuk G. Theoretical basis of hemodynamic MR imaging techniques to measure cerebral blood volume, cerebral blood flow, and permeability. AJNR Am J Neuroradiol 2007; 28:1850-8.
Related Questions
Is it possible to quantify the actual concentration of Gd from its signal in a DSC study?
Why would you want to use a spoiled-GRE technique? How do you pick the parameters?
Is it possible to quantify the actual concentration of Gd from its signal in a DSC study?
Why would you want to use a spoiled-GRE technique? How do you pick the parameters?

