In MRI we often focus on the magnetic properties of tissues (such as magnetic saturation and susceptibility), but two important tissue electrical properties should also be considered:
- Electrical conductivity (σ): the ability of a material to transport charges, or equivalently, to carry an electric current.
- Electrical permittivity (ε): the ability of a material to rotate molecular dipoles and trap/store charge; hence the degree to which a material becomes polarized when placed in an electric field.
Electrical currents in tissues are primarily due to the movement of Na+ ions, so conductivity (σ) reflects Na+ concentration, which may increase locally in tumors and ischemic states (where Na-K pump mechanisms may be damaged). Permittivity (ε) is also increased in certain tumors, being closely related to conductivity (σ) as well as to tissue anisotropy, free water content, and surface charges on proteins. Both σ and ε are tissue-, temperature-, and frequency-dependent.
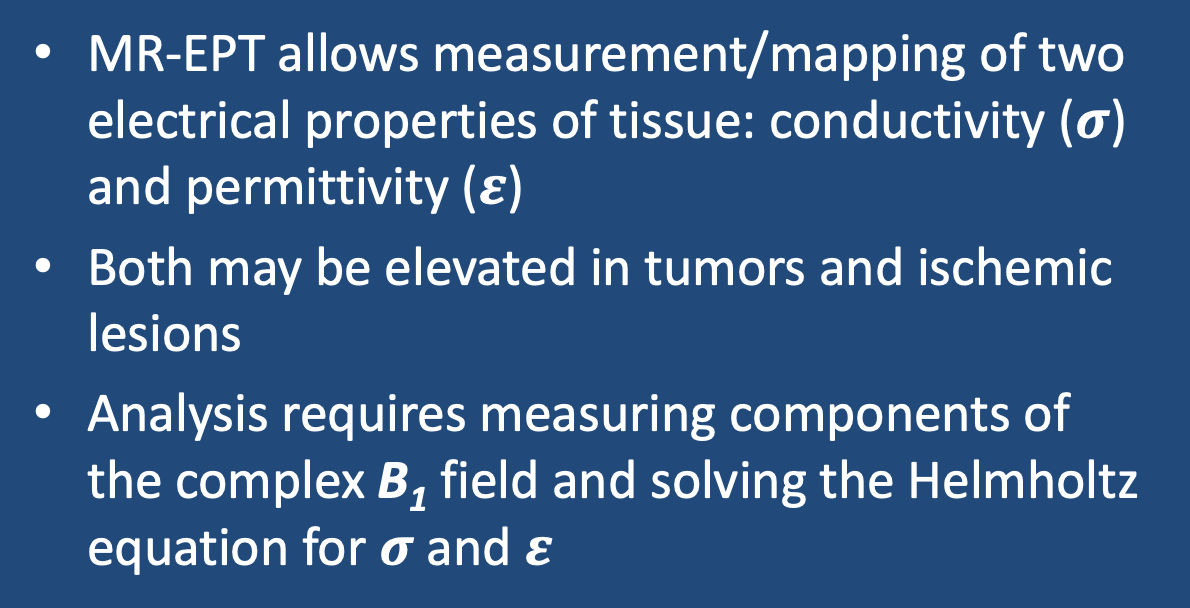
A group of relatively new techniques, dubbed MR-Electrical Properties Tomography (EPT), now allow maps of permittivity (ε) and conductivity (σ) mapping to be performed using MRI pulse sequences. The most commonly used method is based on the generalized Helmholtz equation (a second order differential equation obtained by eliminating the electric field from the source-free first-order Maxwell equations). The standard result is
where B1+ = the circularly polarized complex transmit field in the direction of precession; ω = the Larmor frequency; μ = tissue magnetic permeability, assumed to be equal to μo (the permeability of free space); σ = tissue electrical conductivity; ε = tissue electrical permittivity = the relative tissue permittivity (εr) times the permittivity of free space (εo); and i = the imaginary unit.
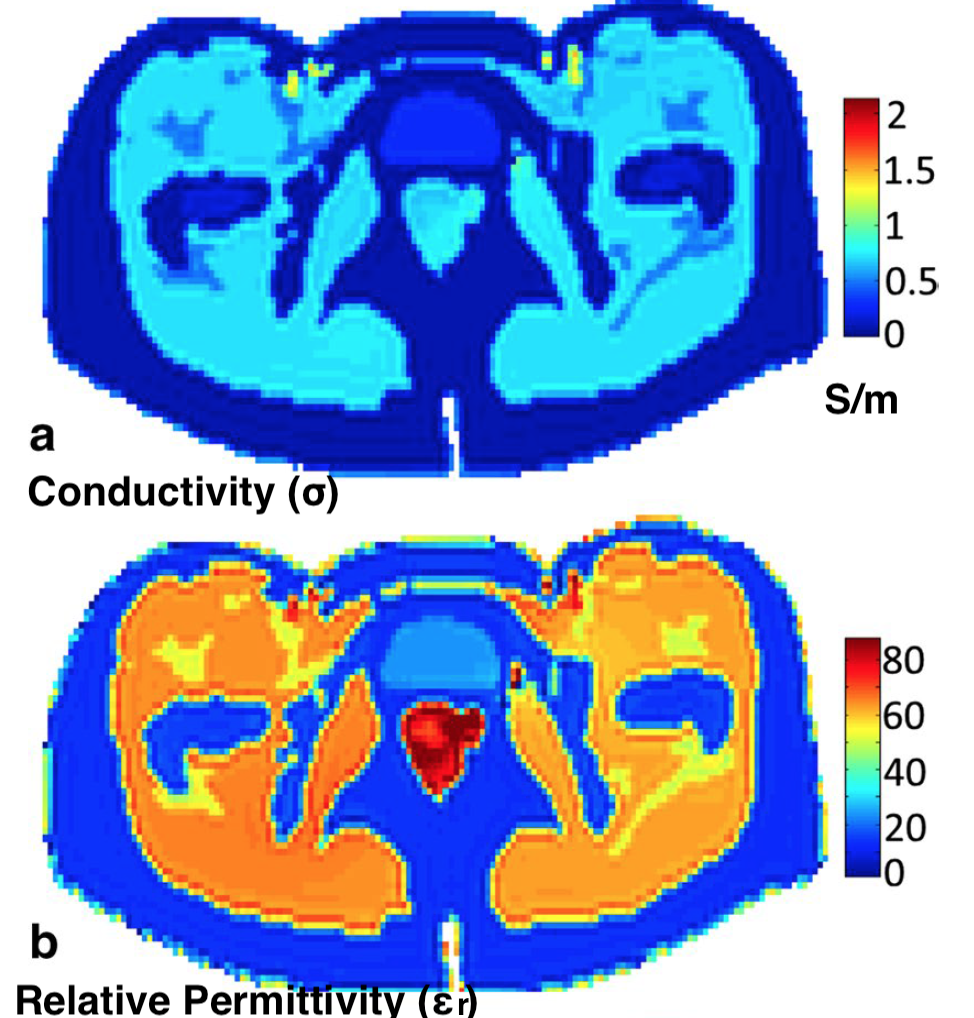
The first step in MR-EPT is to measure the magnitude |B1| and phase ϕ of the complex B1+ field, typically obtained using established B1-mapping techniques (described in the references). Numerical methods can then be used to calculate tissue conductivity and permittivity at each spatial location. More than a dozen such techniques have been proposed, each requiring assumptions and facing limitations at tissue boundaries. Recently, deep learning algorithms have been employed to improve resolution and signal-to-noise. Examples of conductivity and permittivity maps of a pelvic phantom and clinical images of a breast carcinoma are shown below:
Advanced Discussion (show/hide)»
No supplementary material yet. Check back soon!
.References
Balidemaj E, van den Berg CAT, van Lier ALHMW, et al. B1-based SAR reconstruction using contrast source inversion electric properties tomography (CSI-EPT) Med Biol Eng Comput 2017; 55:225-233 [DOI LINK]
Katscher U, Kim D-H, Seo JK. Recent progress and future challenges in MR Electric Properties Tomography. Comput Math Methods Med 2013; Article ID 546562. [DOI Link]
Katscher U, van den Berg CAT. Electric properties tomography: Biochemical, physical and technical background, evaluation and clinical applications. NMR Biomed 2017;30:3729
Leijsen R, Brink W, van den Berg C, et al. Electrical properties tomography: a methodological review. Diagnostics 2021; 11:176. [DOI LINK]
Leijsen R, van den Berg C, Webb A, et al. Combining deep learning and 3D contrast source inversion in MR-based electrical properties tomography. NMR Biomed 2019;e4211. [DOI LINK]
Liu J, Wang Y, Katscher U, He B. Electrical Properties Tomography based on B1 maps in MRI: principles, applications, and challenges. IEEE Trans Biomed Eng. 2017;64:2515-2530.
Tha KK, Katscher U, Yamaguchi S, et al. Noninvasive electrical conductivity measurement by MRI: a test of its validity and the electrical conductivity characteristics of glioma. Eur Radiol. 2018;28:348-355.
Related Questions
What is the dielectric effect and how does it produce artifacts in MRI?
What is the dielectric effect and how does it produce artifacts in MRI?


