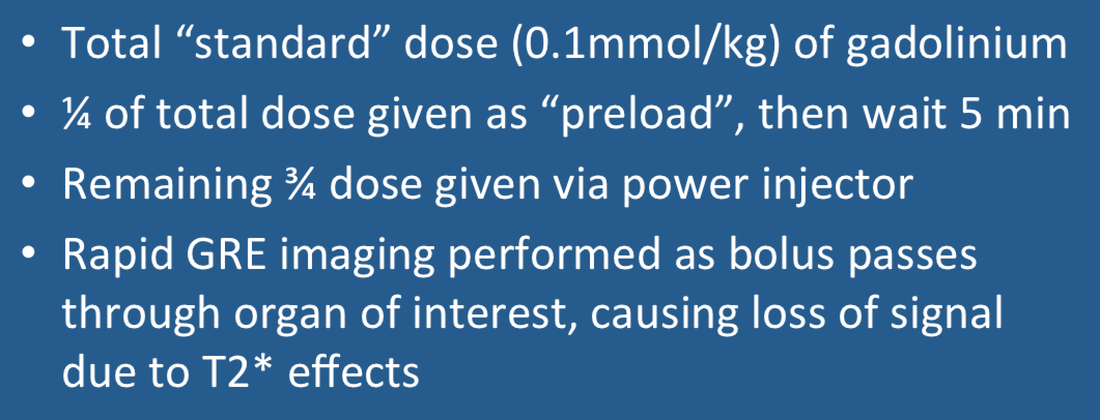
Dynamic Susceptibility Contrast (DSC) perfusion imaging is best performed at 1.5T or higher. An 18- to 20-gage IV catheter is inserted into the right antecubital fossa for administration of gadolinium via power injector. Although any gadolinium-based contrast agent may be used, we prefer gadobenate (MultiHance®) at standard dose (0.1 mmol/kg) due to its safety profile and high T2 relaxivity.
For brain perfusion imaging we administer approximately ¼ to ⅓ of the total gadolinium dose as a preload before the dynamic study is to take place. The preload serves to reduce contaminating T1 effects from contrast agent leakage, especially when high flip angle sequences are used. (Not all centers use a preload, but we feel it is helpful especially in tumors where there may be appreciable contrast agent leakage into tissue). After a 5 minute delay, the remainder of the gadolinium is injected at a rate no less than 3-5 mL/s followed by a 20-mL saline "chaser".
Rapid T2*- or T2-weighted images are obtained over the brain (or other organ of interest) in a cine fashion immediately following the contrast bolus. At present most centers employ a single-shot echoplanar imaging (EPI) technique covering the brain in about 20 slices recorded with a temporal resolution of 1−1.5 seconds per image. At 1.5T we use either a T2*-weighted GRE EPI sequence with TR/TE/α = 2000/50/35° or a T2-weighted SE EPI sequence with TR/TE/α = 1500/30/90°.
|
As the gadolinium bolus first passes through the regional circulation, it remains largely or completely within the vascular space. This vascular compartmentalization of gadolinium produces a local magnetic field distortion (susceptibility effect) in the vicinity of vessels with T2 (T2*)-dephasing and drop in signal during transit. Note that this effect is opposite to that seen in CT perfusion imaging, where tissue attenuation increases during passage of an iodine contrast bolus.
|
Sequential T2* GRE images obtained during first passage of a gadolinium bolus shows loss of signal in and around vessels
|
|
MR signal intensities can be plotted on a pixel-by-pixel basis as shown in the diagram left. Both qualitative and semiquantitative perfusion indices can be derived from this data including arrival time (AT), time-to-peak (TTP), and area under the curve (AUC), also known as the negative enhancement integral (NEI). These and other parameters are described in more detail in a later Q&A.
|
Advanced Discussion (show/hide)»
So as not to waste time waiting for 5 minutes between the preload and full dose contrast administration, we commonly perform our conventional T2-weighted imaging sequence or acquire T1-weighted image data for a DCE study during this period.
References
Essig M, Shiroishi MS, Nguyen TB, et al. Perfusion MRI: the five most frequently asked technical questions. AJR Am J Roentgenol 2013; 200:24-34.
Jahng G-H, Li K-L, Ostergaard l, Calamante F. Perfusion magnetic resonance imaging: a comprehensive update on principles and techniques. Korean J Radiol 2014; 15:554-577.
McGehee BE, Pollock JM, Maldjian JA. Brain perfusion imaging: how does it work and what should I use? J Magn Reson Imaging 2012; 36:1257-1272.
Welker K, Boxerman J, Kalnin A, et al. ASFNR recommendations for clinical performance of MR dynamic susceptibility contrast perfusion imaging of the brain. AJNR Am J Neuroradiol 2015; 36: E41-E51.
Related Questions
If gadolinium contrast is used to increase signal intensity on routine MR images, why does it decrease signal on DSC perfusion images?
What are the differences between DSC, DCE and ASL perfusion methods used in MRI?
If gadolinium contrast is used to increase signal intensity on routine MR images, why does it decrease signal on DSC perfusion images?
What are the differences between DSC, DCE and ASL perfusion methods used in MRI?

