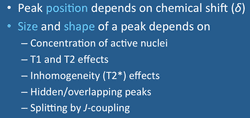
The position of a peak along the NMR spectrum is constant and depends on its chemical shift (δ). As described in a prior Q&A, chemical shift is determined by the local molecular environment of the nucleus being imaged.
The size and shape of a peak at a given spectral position is variable and depends on five major factors: (1) the concentration of nuclei giving rise to a particular line; (2) the T1 and T2 relaxation times of the metabolite, also affected by the TR and TE of the MRS sequence; (3) magnetic inhomogeneity across the sample, controlled by shimming; (4) the presence of hidden/overlapping peaks; and (5) whether the line is single or a multiplet.
The size and shape of a peak at a given spectral position is variable and depends on five major factors: (1) the concentration of nuclei giving rise to a particular line; (2) the T1 and T2 relaxation times of the metabolite, also affected by the TR and TE of the MRS sequence; (3) magnetic inhomogeneity across the sample, controlled by shimming; (4) the presence of hidden/overlapping peaks; and (5) whether the line is single or a multiplet.
Concentration of Active Nuclei
All other factors being equal, the relative sizes of two spectral lines reflect the concentration of nuclei giving rise to each peak. For example, a 1M sample of tetramethylsilane (Si(CH3)4) with 12 spectroscopically identical ¹H atoms per molecule would theoretically produce a spectral line three times as large as a 1M sample of methane (CH4) with only 4 ¹H atoms per molecule. Thus peak heights do not reflect the molar concentration of metabolites per se, but the concentration of active nuclei in a those metabolites.
Effects of T1 and T2 Relaxation
Excluding macromolecules, most individual ¹H metabolites have T1 and T2 values in the range of a few hundred to over 1000 msec, similar to relaxation times measured in whole organs. As with MR imaging, MR spectroscopy sequences contain operator-selectable parameters (TR and TE) that act together with T1 and T2 to affect the size and shape of spectral lines.
TR controls T1 weighting. When TR is much shorter than the T1 of a metabolite, the longitudinal magnetization of that metabolite does not fully recover between excitations and its peak height will be reduced.
 Full Width Half Maximum (FWHM) of a spectral peak
As with MR imaging, T2 determines the rate of decay of the spectroscopic signal. MRS sequences aquired at long TE's will have smaller peaks since more T2 decay has occurred. For a fixed TE, metabolites with shorter T2's will decay faster and have smaller peaks than those with longer T2's.
T2 strongly affects the width of a spectral peak. The line width of a peak is defined by its Full Width Half Maximum (FWHM) — the width of the peak measured at 50% of its maximum height. Spectral peaks are generally considered to have Lorentzian line shapes, and under this condition in a homogenous field, the FWHM (in Hz) is proportional to (1/πT2). Metabolites with long T2's will have narrow peaks while those with shorter T2's will be wider.
T2 strongly affects the width of a spectral peak. The line width of a peak is defined by its Full Width Half Maximum (FWHM) — the width of the peak measured at 50% of its maximum height. Spectral peaks are generally considered to have Lorentzian line shapes, and under this condition in a homogenous field, the FWHM (in Hz) is proportional to (1/πT2). Metabolites with long T2's will have narrow peaks while those with shorter T2's will be wider.
Line Broadening by Inhomogeneity (T2*) Effects
 Reduced line widths with proper shimming
In real life magnetic field inhomogeneities are always present, so the spectroscopic signal decays at the rate of T2* (which is always shorter than T2). These inhomogenety (T2*) effects broaden all spectral lines. That is why magnetic field shimming is essential before any spectroscopic measurements are made.
Hidden/Overlapping Peaks
Spectral lines of two different metabolites may be superimposed or overlap, producing what appears to be a single peak that is broader or taller than expected. Common examples include the overlap of lactate (δ=1.33) and lipid (δ=1.3) or NAA (δ=2.01) and NAAG (δ=2.04).
Singlet vs Multiplet Peaks
A final factor determining the appearance of peaks is whether they are split into two or more subpeaks, also known as multiplets. Splitting of spectral peaks results from an electron-mediated interaction of two nuclear spins residing on the same molecule. The phenomenon is known as J-coupling, whose mechanism is described more completely in the next Q&A. The take-home point that if a peak is split into multiplets by a J-coupling interaction, the overall complex of subpeaks will be smaller and broader than the original peak would have been without coupling.
Advanced Discussion (show/hide)»
No supplementary material yet. Check back soon!
References
Jansen JFA, Backes WH, Nicolay K, Kooi ME. ¹H MR spectroscopy of the brain: absolute quantification of metabolites. Radiology 2006; 240:318-332.
Minati L, Aquino D, Bruzzone MG, Erbetta A. Quantitation of normal metabolite concentrations in six brain regions by in-vivo ¹H-MR spectroscopy. J Med Phys 2010; 35:154-163.
Related Questions
What is meant by a chemical shift?
What is the difference between T2 and T2*?
Why do some spectra split into smaller peaks while others do not?
What is meant by a chemical shift?
What is the difference between T2 and T2*?
Why do some spectra split into smaller peaks while others do not?
