|
Many diffuse diseases of heart muscle (cadiomyopathies) may not produce focal changes in signal intensity, motion, or enhancement on routine cardiac MRI studies. These disorders, however, may affect global myocardial NMR properties, such as T1, T2, or T2* relaxation times. Specialized pulse sequences optimized for cardiac imaging are able to estimate these relaxation values and even create color anatomic overlay maps for each parameter. On this web page I will discuss T1-mapping; later Q&A's will describe T2-mapping (for edema detection) and T2* measurements (for iron deposition).
|
The T1 value of normal myocardium at 1.5T is approximately 950-1000 ms at 1.5T and 1100-1250 at 3.0T. Myocardial T1 is prolonged in most forms of pathology, including edema (from acute infarction or myocarditis) and as the end result of many chronic cardiac and systemic disorders (such as hypertrophic, toxic, and dilated cardiomyopathies; remote ischemia/infarction; diabetes; valvular disease; amyloidosis; and sarcoidosis). T1 shortening due to pathology is rare, but can be seen in disorders like Fabry disease, fatty arrythmogenic right ventricular dysplasia (ARVD), or hemochromatosis where glycoproteins, lipids, or iron respectively are deposited in the myocardium. Of course, gadolinium contrast accumulation shortens T1 values in both healthy and diseased myocardium.
T1-myocardial mapping may be performed either with or without contrast. When done without contrast it is commonly referred to as "native" T1-mapping. Administration of gadolinium contrast shortens the T1 of both normal and diseased myocardium. Postcontrast T1-mapping may be useful to better differentiate and quantify enhancement in various areas of the heart.
|
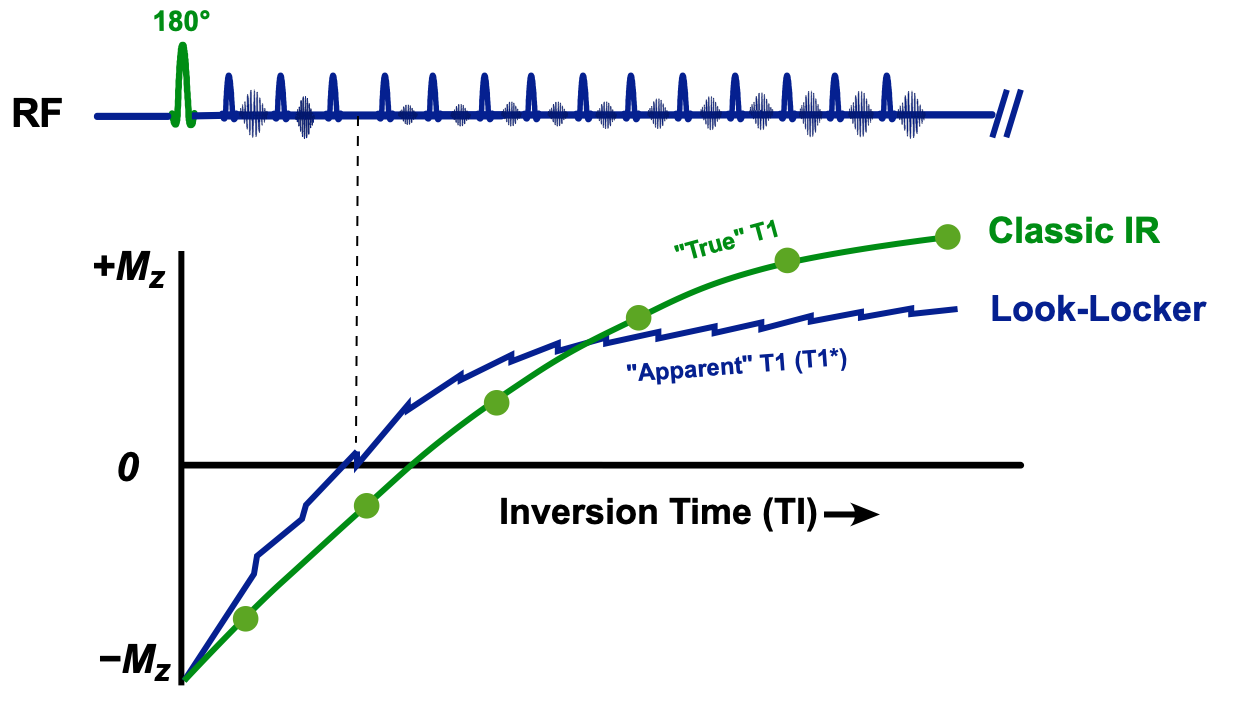
The traditional "gold standard" method for determining tissue T1 is to perform a series of independent single-point inversion recovery signal measurements at different TI's. Very long TR's are required to allow the restoration of full longitudinal magnetization Mo between measurements. These data points lie along an exponential growth curve (shown in green in the diagram right). By mathematical fitting T1 can be easily calculated. The single-point IR method may require 20+ minutes of data sampling, and hence is too time-consuming for practical clinical application.
|
Even before the development of MR imaging, laboratory NMR chemists searched for faster ways to determine the T1's of their samples. In 1970 Look and Locker reasoned that instead of making a single measurement at a fixed TI after inversion, many more data points could be acquired by sampling a periodic train of rapidly applied constant flip-angle pulses. If the RF-pulse train were sufficiently long, the longitudinal magnetization would be driven to a new steady state (which, of course, would be lower than the undisturbed equilibrium state (Mo) of the classic IR method). An estimate for T1 could nevertheless be derived by observing the rate of change of signal amplitudes sampled during this periodic pulse train.
Notwithstanding the theoretical corrections, T1 values computed by the Look-Locker method depend on a number of factors, including type of pulse sequence (GRE vs b-SSFP), flip angle, TR, tissue T2, field strength, magnetization transfer effects, RF-inhomogeneity, and heart rate. Because of this experimental dependency, we are not measuring "true" T1, but a consistently shorter "apparent" T1. Analogous to the term used in T2 relaxation, apparent T1 is often called T1* ("T1-star").
|
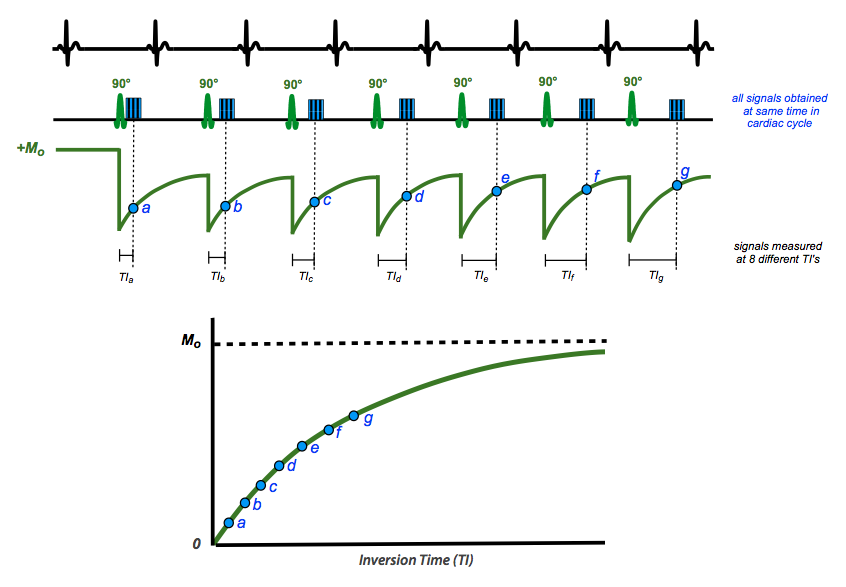
At present the most widely used T1 measurement sequence is Modified Look-Locker Imaging (MOLLI). The basic strategy is to use only 2-3 inversion pulses followed by several single-shot b-SSFP readouts at various fixed inversion times. Short rest periods are interspersed to allow recovery of longitudinal magnetization between cycles. In conjunction with parallel imaging and conjugate symmetry methods, MOLLI allows accurate T1-values of myocardium to be obtained in only one breath-hold per slice (~20 sec).
|
In one common implementation illustrated above, 5(3)3 MOLLI, measurements are obtained at different TI's over 5+3=8 heart beats with a 3 beat recovery period in between. The inversion pulses are placed so that readout periods (a, b, c, ...) all occur at the same place in the cardiac cycle, allowing pixel-wise T1 calculations to be performed. The recovery period may be reduced on post-contrast imaging due to the lower T1 values of gadolinium-containing myocardium. For patients who cannot suspend respiration for 20+ seconds, shortened MOLLI (shMOLLI) using a 5-1-1 scheme is available.
Advanced Discussion (show/hide)»
A step beyond simple T1-mapping is calculation of extracellular myocardial volume (ECV). The T1-relaxation rate (R1=1/T1) of any tissue changes proportionally with the gadolinium concentration. The T1 mapping methods described above allow the relaxation rates of blood and myocardium to be calculated before and after contrast administration. Assuming fast exchange of water molecules and a 2-compartment model, the ECV can then be calculated by the formula
ECV = {ΔR1myocardium / ΔR1blood} × {1 − Hct}
where ΔR1 is the change of relaxation rates for myocardium and blood pre- and post-contrast, and Hct is the hematocrit. (An adjustment for Hct must be made since gadolinium resides only in plasma and does not enter intact red blood cells).
References
Aherne E, Chow K, Carr J. Cardiac T1 mapping: techniques and applications. J Magn Reson Imaging 2020; 51:1336-1356. (excellent recent review)
Burt JR, Zimmerman SL, Kamel IR, et al. Myocardial T1 mapping: techniques and potential applications. RadioGraphics 2014; 34:377-395.
Chow K, Flewitt JA, Green JD, et al. Saturation recovery single-shot acquisition (SASHA) for myocardial T(1) mapping. Magn Reson Med 2014; 71:2082-95.
Haaf P, Garg P, Messroghli DR, et al. Cardiac T1 mapping and extracellular volume (ECV) in clinical practice: a comprehensive review. J Cardiovasc Magn Reson 2016; 18:69. (excellent recent review with a clinical focus)
Hamlin SA, Henry TS, Little BP, et al. Mapping the future of cardiac MR imaging: case-based review of T1 and T2 mapping techniques. Radiographics 2014; 34:1594-1611.
Jerosch-Herold M, Kwong RY. Cardiac T1 imaging. Top Magn Reson Imaging 2014; 23:3-11.
Kellman P, Hansen MS. T1-mapping in the heart: accuracy and precision. J Cardiovasc Magn Reson 2014; 16:2. (great review discussing advantages and limitations of each technique)
Look DC. Locker DR. Time saving in measurement of NMR and EPR relaxation times. Rev Sci Instrum 1970; 41:250-1. (original technique developed for chemical NMR, not practical for clinical MRI).
Messroghli DR, Moon JC, Ferreira VM, et al. Clinical recommendations for cardiovascular magnetic resonance mapping of T1, T2, T2* and extracellular volume: a consensus statement by the Society for Cardiovascular Magnetic Resonance (SCMR) endorsed by the European Association for Cardiovascular Imaging (EACVI). J Cardiovasc Magn Reson. 2017;19:75.
Messroghli DR, Plein S, Higgins DM, et al. Human myocardium: single-breath-hold MR T1 mapping with high spatial resolution—reproducibility study. Radiology 2006; 238:1004-1012.
Messroghli DR, Radjenovic A, Kozerke S, et al. Modified Look-Locker Inversion Recovery (MOLLI) for high-resolution T1 mapping of the heart. Magn Reson Med 2004; 52:141-146.
Moon JC, Messroghli DR, Kellman P, et al. Myocardial T1 mapping and extracellular volume quantification: a Society for Cardiovascular Magnetic Resonance (SCMR) and CMR Working Group of the European Society of Cardiology consensus statement. J Cardiovasc Magn Reson 2013; 15:92.
Piechnik SK, Ferreira VM, Dall'Armellina E, et al. Shortened modified Look-Locker inversion recovery (shMOLLI) for clinical myocardial T1-mapping at 1.5 and 3 T within a 9 heartbeat breathhold. J Cardiovasc Magn Reson 2010; 12:69
Schelbert EB, Messroghli DR. State of the art: Clinical applications of cardiac T1 mapping. Radiology 2016; 278:658-676.
Related Questions
How do you set the IR parameters to achieve desired image contrast?
How do you set the IR parameters to achieve desired image contrast?


