|
As described in a previous Q&A, the MR signal is an induced current generated by precession of the net magnetization (M) after stimulation by an RF- pulse. The signal is commonly detected in quadrature using receiver coils sensitive to magnetic flux in two orthogonal directions. Output channels, denoted I and Q (for "in phase" and "quadrature" respectively), send their respective signals along separate digitization and amplifier pathways. These signals are ultimately demodulated, processed, and recombined to create the final MR image.
|
|
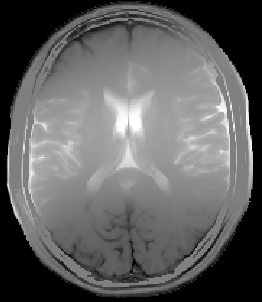
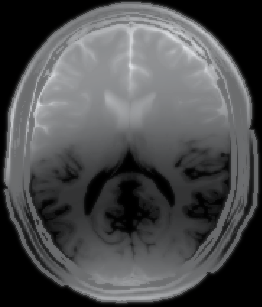
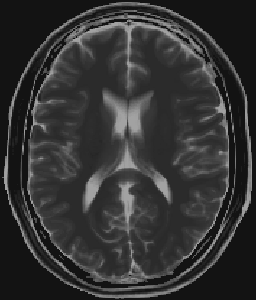
The MR signal can be represented as a vector with real (Re) and imaginary (Im) components recorded from the I and Q channels respectively. An equivalent/alternative representation of the signal is as a complex number
Signal = (Re, Im) = Re + i Im
where i² = −1, the imaginary unit. Its magnitude and phase can be calculated by simple trigonometry.
|
Advanced Discussion (show/hide)»
Additional notes concerning non-quadrature receiver coils
Some single simple loop coils used in MR imaging are linearly polarized, not quadrature. This means that they only record a single channel of MR signal initially. I and Q channel signals can still be created from this single source, however, by splitting the signal into two parts and phase-shifting one by 90° using digital or analog techniques. This allows real and imaginary data to be input into the array processor, the format expected for standard Fast Fourier Transformation (FFT). No √2 improvement in signal-to-noise is achieved, however, since the same signals and noise are present in each channel.
Additional notes on signal-to-noise
It is generally assumed that the noise distribution in each channel is stationary, uncorrelated, and "white", having a Gaussian probability distribution. After inverse Fourier transformation of the complex data, the noise is still Gaussian.
A common property of Gaussian distributions (proved in introductory college probability theory courses) is that the sum of two Gaussian variables each with standard deviations σ is also Gaussian but with standard deviation σ(√2). Hence when the signals and noise from the I and Q channels are combined, the total signal-to-noise ratio is increased by a factor of (√2) = 1.41.
This simple analysis is not quite right when magnitude images are considered, however, as the noise probability distribution is no longer strictly "white". Since the magnitude is a sum of squares, the noise now has a Rician distribution. As the signal-to-noise approaches zero, the Rician distribution converges to a Rayleigh distribution. If the SNR is higher than about 2 then the noise probability distribution is approximately Gaussian again. In most MR imaging applications the SNR is in this higher range, allowing the Gaussian approximation to hold.
Stormont RS, Anas MC, Pelc NJ. Radio frequency receiver for a NMR instrument. US Patent #4992736A, published 12 Feb 1991.
What is the difference between linearly polarized (LP) and a circularly polarized (CP) coils?


