|
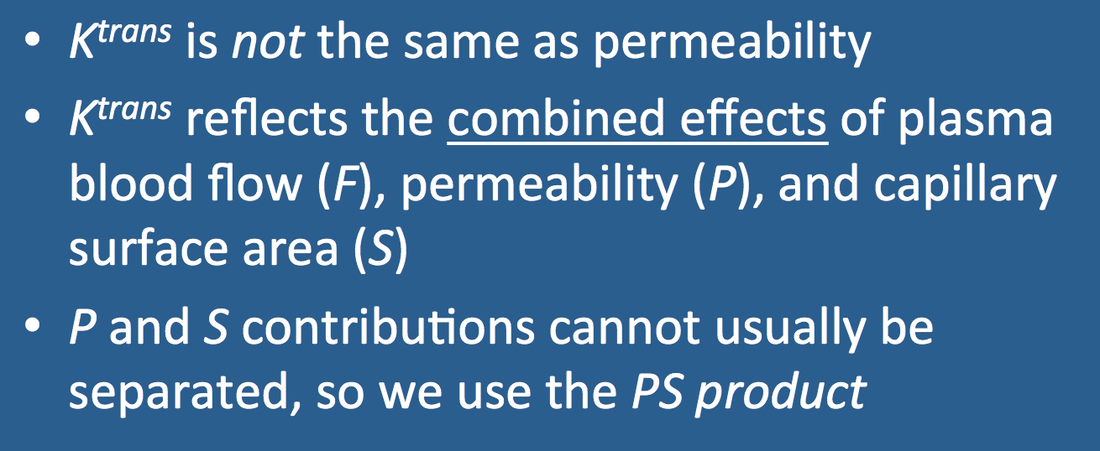
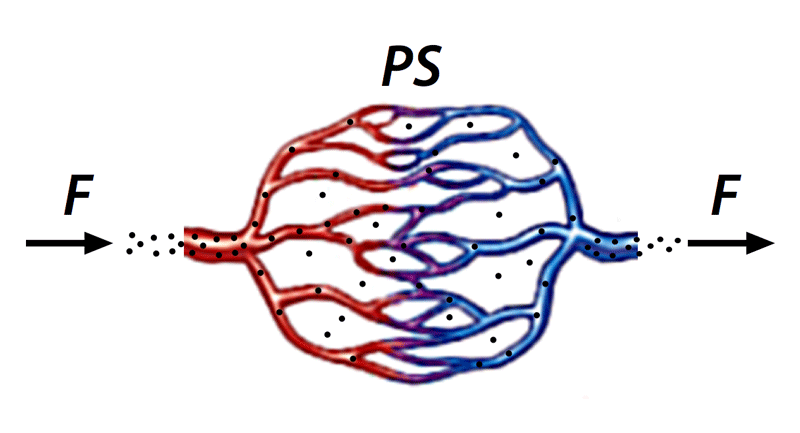
The volume transfer constant (Ktrans) reflects the efflux rate of gadolinium contrast from blood plasma into the tissue extravascular extracellular space (EES). Ktrans depends on three factors: plasma blood flow (F), vascular permeability (P), and capillary surface area (S) per unit mass. In practice the individual contributions of permeability and surface area cannot clearly separated and it is therefore common to consider them together as the so-called PS product. |
In general the individual contributions of F, P, and S to Ktrans cannot be separated. Two limiting cases, however, shed some light on the relative importance and interaction of these three factors.
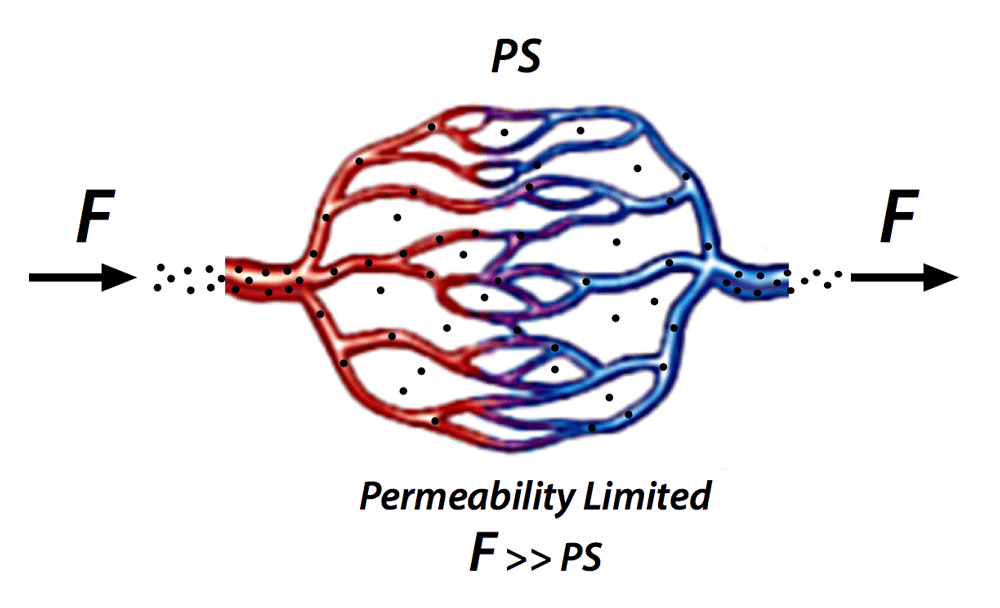
Case 1 (Permeability limited). In this case, pictured below left, plasma blood flow (F) is much greater than the PS product. Plenty of gadolinium is delivered to tissue and the amount transferred into the interstitial space depends solely on the size and permeability of the capillary bed. In this situation, Ktrans = P×S.
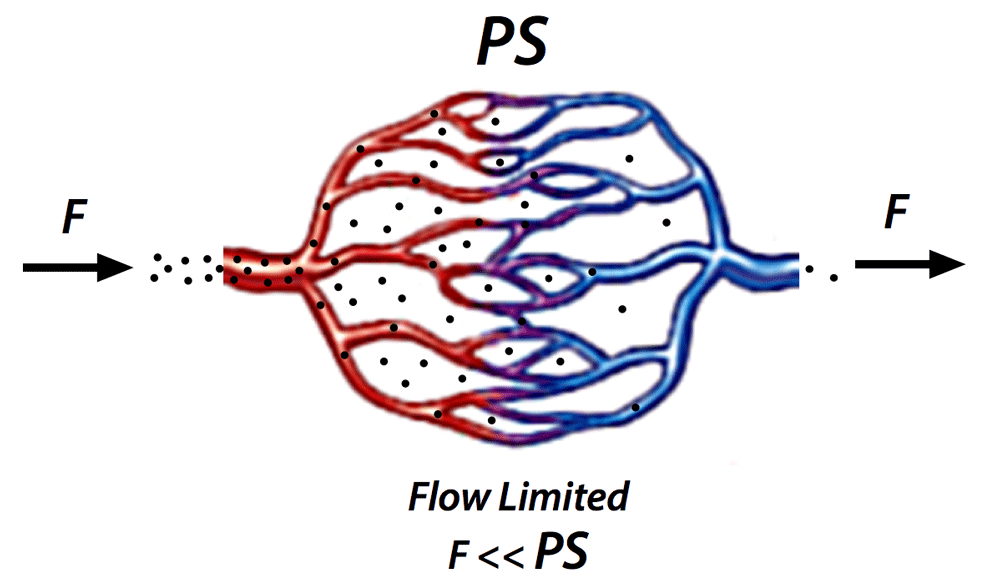
Case 2 (Flow limited). Here plasma blood flow (F) is much smaller than the PS product. In this case virtually all the gadolinium leaks into the EES before reaching the venous side of the capillary bed. In this situation, Ktrans = F.
Advanced Discussion (show/hide)»
The units used for capillary permeability (cm/min) are not immediately obvious. Permeability (P) is defined as the number of moles of a solute passing through a given surface area (cm²) of a membrane over a period of time (min) driven by a concentration difference (moles/cm³). The units for P can therefore be written
P = [moles]/[cm²]/[min]/[moles/cm³] = cm/min
Similarly, the quantity denoted by S is not meant to represent the capillary the surface area in cm², but a "surface area scaled per unit mass of tissue." S thus has dimensions of area/mass (e.g., cm²/100g). Together, therefore, the PS product has units of [cm/min]•[cm²/100g] = cc/min/100g, the same as flow (F).
Cuenod CA, Balvay D. Perfusion and vascular permeability: basic concepts and measurement in DCE-CT and DCE-MRI. Diagn Interv Imaging 2013; 94:1187-1204. (Good review of basic mechanisms; some terminology is slightly different than abbreviations used in Tofts models).
Pappenheimer JR. Passage of molecules through capillary walls. Physiol Rev 1953; 33;387-423. Sourbron S, Ingrisch M, Siefert A, et al. Quantification of cerebral blood flow, cerebral blood volume, and blood-brain-barrier leakage with DCE-MRI. Magn Reson Med 2009; 62:205-217.
Tofts PS. T1-weighted DCE imaging concepts: modelling, acquisition and analysis. MAGNETOM Flash 2010; 3:30-35.
Zhang N, Zhang L, Qui B, et al. Correlation of volume transfer coefficient Ktrans with histopathologic grades of gliomas. J Magn Reson Imaging 2012; 36:355-363.
What quantitative parameters can be extracted from the DCE data?
How do calculated DCE parameters relate to patterns of enhancement we see on clinical images?


