Susceptibility-weighted images (SWI) are generated from gradient-echo (GRE) pulse sequences. GRE sequences are sensitive to differences in tissue susceptibility because they lack the ability to refocus spins dephased by magnetic field inhomogeneities.
Although simple T2*-weighted GRE sequences have traditionally been used for the detection of iron/blood products and calcifications, modern SWI sequences incorporate several features and enhancements making them superior. SWI sequences are typically acquired in 3D (rather than 2D) mode, allowing thinner slices and smaller voxel sizes to be obtained. Flow compensation in all three directions is used to reduce artifacts and parallel imaging is employed to reduce imaging time. Either single or multiple echoes may be acquired in a given TR interval. A key feature of SWI is that magnitude and phase information are independently processed/displayed as well as combined for diagnostic purposes.
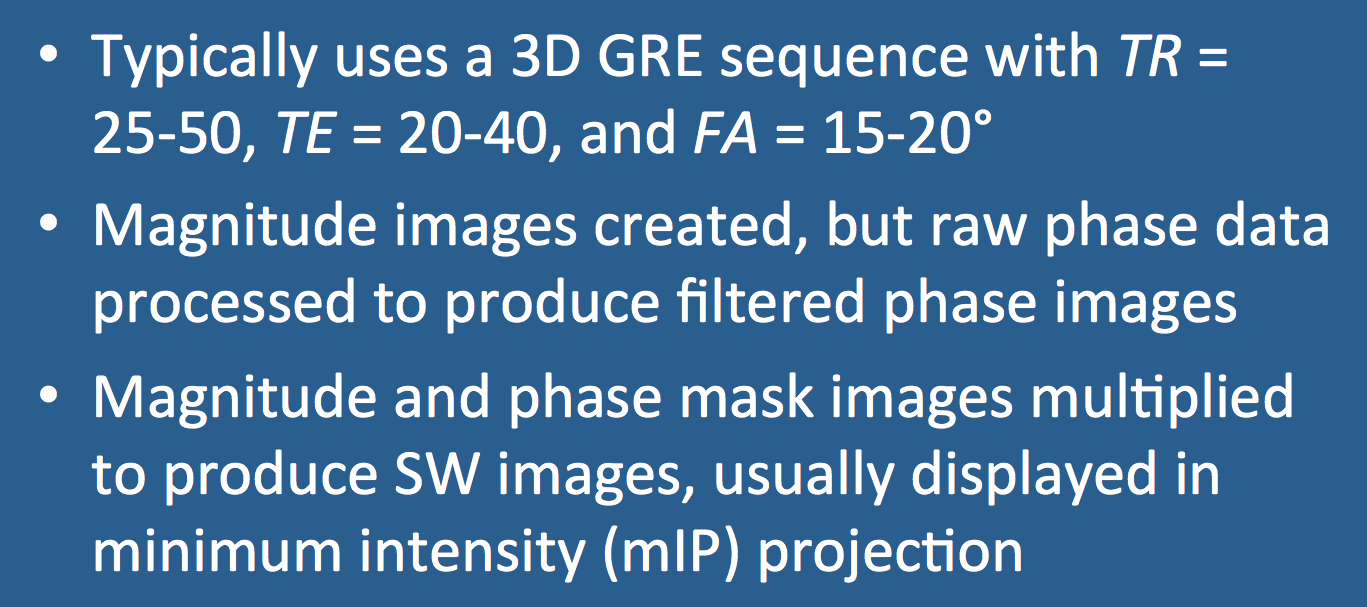
Typical imaging parameters include TR = 25-50 ms, TE = 20-40 ms, and flip angles = 15-20º. Shorter times and smaller flip angles are used as field strength increases.
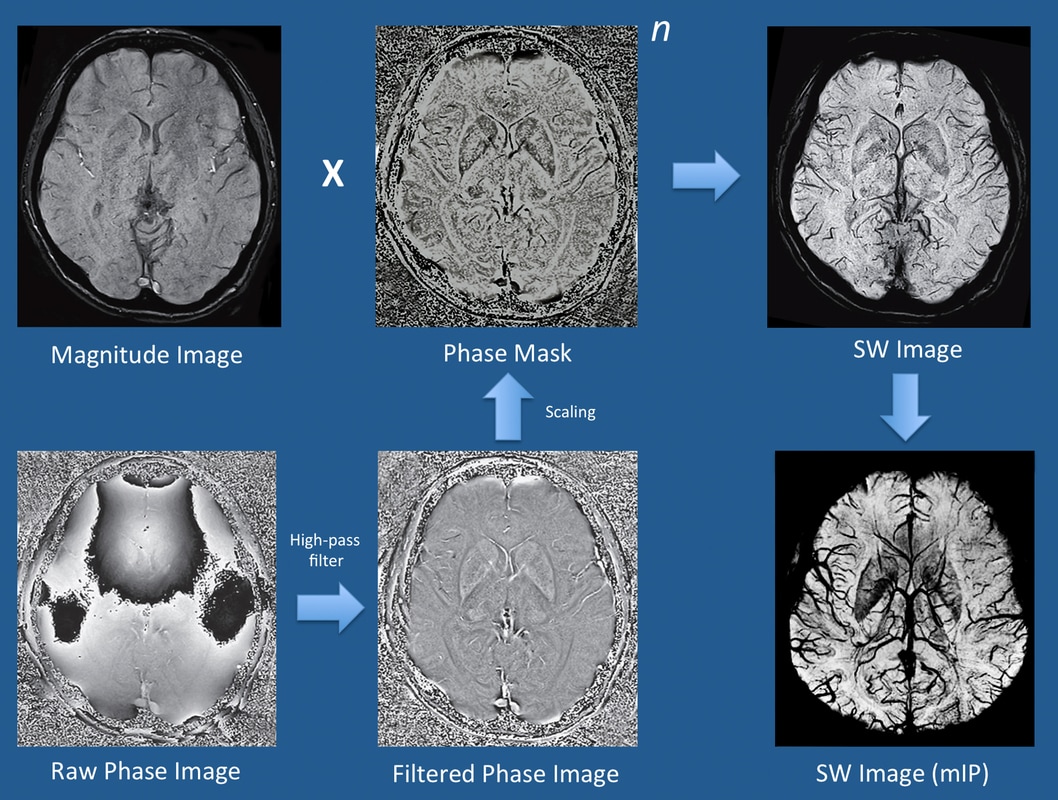
The precise methods employed by major MR vendors differ and are proprietary, but are largely based on strategies similar to those first described by Haacke et al (2004) and illustrated below. Using quadrature detection, both magnitude and phase data are separately reconstructed. The magnitude image is saved for diagnostic purposes, displaying background tissue with spin-density-like contrast.
Phase data must undergo further processing to be clinically useful, however. The raw phase image is dominated by large but slowly changing "macro"-susceptibility gradients due to generalized field inhomogeneities as well as distortions due to air and bone at the skull base. Digital high-pass filtering can be used to remove these low-frequency fluctuations, and additional local phase correction algorithms may be employed to reduce artifacts at the skull base. The end result is a filtered phase image that is saved and used for diagnostic purposes, as described in the following Q&A.
Phase data must undergo further processing to be clinically useful, however. The raw phase image is dominated by large but slowly changing "macro"-susceptibility gradients due to generalized field inhomogeneities as well as distortions due to air and bone at the skull base. Digital high-pass filtering can be used to remove these low-frequency fluctuations, and additional local phase correction algorithms may be employed to reduce artifacts at the skull base. The end result is a filtered phase image that is saved and used for diagnostic purposes, as described in the following Q&A.
A phase mask is next created that scales data from the filtered phase images over a 0-1 range to accentuate tissues with different susceptibilities. The magnitude image is digitally multiplied by this phase mask several times until the desired mix of phase information is imparted (denoted by the exponent "n" in the diagram below). In practice, n = 4 complex multiplications are typically performed. The end result is a susceptibility-weighted (SW) image, which simultaneously contains both magnitude and phase information and is used for clinical diagnosis. Minimum intensity projections (mIPs) of the SW image are typically displayed, which vary in thickness depending on how many of the original 3D source images are stacked together.
All major MR vendors offer susceptibility-based sequences under their own trade names. Siemens calls theirs simply SWI and uses a method most akin to Haacke's. GE offers SWAN (Susceptibility Weighted ANgiography), Philips offers SWIp (SWI-phase, formerly called VenoBOLD), Hitachi has BSI (Blood Sensitive Imaging), and Canon offers FSBB (Flow Sensitive Black Blood).
Advanced Discussion (show/hide)»
No supplementary material yet. Check back soon!
References
Chavhan GB., Babyn PS, Thomas B, Shroff MM, Haacke EM. Principles, techniques, and applications of T2*-based MR imaging and its special applications. Radiographics 2009; 29:1433-1449. (good review of traditional GRE T2*-weighted imaging with a lead-in to SWI)
Duyn J. MR susceptibility imaging. J Magn Reson 2013; 229:198-207. (good historical review)
Haacke EM, Xu Y, Cheng Y-C, Reichenbach JR. Susceptibility weighted imaging (SWI). Magn Reson Med 2004; 52:612-618. (Describes processing method now used for most commercial SWI sequences)
Haacke EM, Mittal S, Wu Z, Neelavalli J, Cheng Y-CN. Susceptibility-weighted imaging: technical aspects and clinical applications, part 1. AJNR Am J Neuroradiol 2009; 30:19-30. (technical features)
Mittal S, Wu Z, Neelavalli J, Haacke EM. Susceptibility-weighted imaging: technical aspects and clinical applications, part 2. AJNR Am J Neuroradiol 2009; 30:232-252. (clinical applications)
Young IR, Khenia S, Thomas DGT, et al. Clinical magnetic susceptibility mapping of the brain. J Comput Assist Tomogr 1987; 11:2-6. (First demonstration of clinical SWI)
Related Questions
How do you distinguish blood from calcifications on SWI phase maps?
How do you distinguish blood from calcifications on SWI phase maps?

