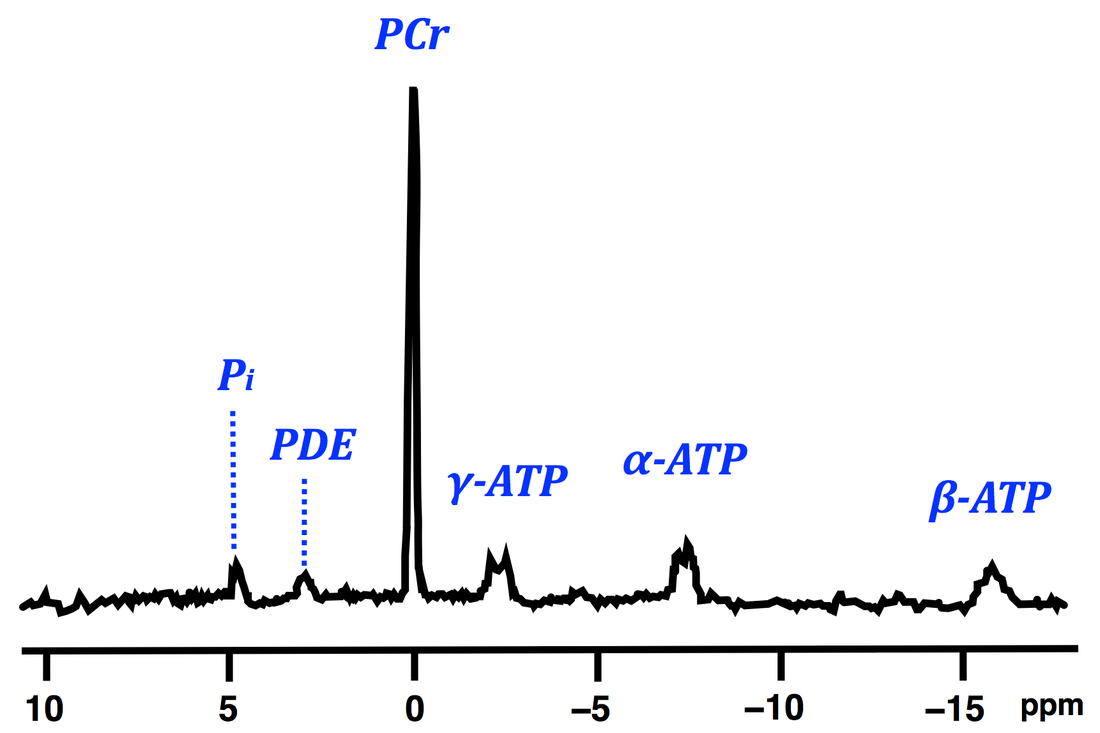
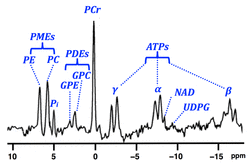
As with ¹H spectroscopy, organ-specific differences in ³¹P spectra also exist. Examples of ³¹P MRS from skeletal muscle, brain, and liver are pictured below.
|
Skeletal muscle spectra is dominated by the large phosphocreatine (PCr) resonance at δ = 0 ppm which makes other peaks look small. Over 60% of total body stores of energy-providing PCr are contained within skeletal muscle.
|
A relatively "balanced-looking" spectrum, the brain shows a mixture of energy-related metabolites (PCr, ATPs, NAD) in the upfield (−δ range). Downfield (+δ range) are predominantly membrane phospholipids, including PMEs and PDEs.
|
Perhaps the most notable feature of liver ³¹P MRS is the absence of a measurable PCr peak (also missing in kidney spectra). Phosphodiesters (PDEs), including GPE and GPC are the largest peaks. Also note PdtC resonance contaminant from bile.
|
Abbreviations: Adenosine Triphosphate (ATP), Phosphocreatine (PCr), Inorganic Phosphate (Pi), Phosphodiesters (PDE), Glycerophosphocholine (GPC), Glycerylphosphorylethanoamine (GPE), Phosphomonoesters (PME), Phosphorylethanolamine (PE), Phosphorylcholine (PC), Nicotine adenine dinucleotide (NAD), Uridine diphosphate glucose (UDPG), Phosphatidylchoine (PtdC)
More detailed organ-specific differences in ³¹P Spectroscopy are provided in the table below.
Advanced Discussion (show/hide)»
No supplementary material yet. Check back soon!
References
Boska MD, Meyerhoff DJ, Twieg DB, et al. Image-guided ³¹P magnetic resonance spectroscopy of normal and transplanted kidneys. Kidney Internat 1990; 38:294-300.
Chmelík M, Valkovič L, Wolf P, et al. Phosphatidylcholine contributes to in vivo ³¹P MRS signal from the human liver. Eur Radiol 2015; 25:2059-2066.
Dezortova M, Taimr P, Skoch A et al. Etiology and functional status of liver cirrhosis by ³¹P MR spectroscopy. World J Gastroenterol 2005;11:6926-31.
Ha D-H, Choi S, Oh JY, et al. Application of ³¹P MR spectroscopy to the brain tumors. Korean J Radiol 2013; 14:477-486.
Jung W-I, Staubert A, Widmaier S, et al. Phosphorus J-coupling constants of ATP in human brain. Magn Reson Med 1997; 37:802-4.
Koretsky AP, Wang S, Murphy-Boesch J, et al. ³¹P NMR spectroscopy of rat organs, in situ, using chronically implanted radiofrequency coils. Proc Natl Acad Sci USA 1983; 80:7491-7495.
Lanza IR, Bhagra S, Nair KS, Port JD. Measurement of human skeletal muscle oxidative capacity by ³¹P-MRS: a cross-validation with in vitro measurments. J Magn Reson Imaging 2011; 34:1143-1150.
Meyerspeer M, Krssak M, Moser E. Relaxation times of ³¹P-metabolites in human calf muscle at 3 T. Magn Reson Med 2003; 49:620-625.
Murphy-Boesch J, Stoyanova R, Srinivasan R, et al. Proton-decoupled ³¹P chemical shift imaging of the human brain in normal volunteers. NMR Biomed 1993; 6:173-180.
Schlemmer H-P W, Sawatzki T, Sammet S, et al. Hepatic phospholipids in alcoholic liver disease assessed by proton-decoupled ³¹P magnetic resonance spectroscopy. J Hepatol 2005; 42:752-759.
Segebarth C, Grivegnee A, Luyten PR, Den Hollander JA. 1H image-guided localized 31P MR spectroscopy of the human liver. Magn Reson Med Biol 1988; 1:7-16.
ten Hove M, Neubauer S. Evaluating metabolic changes in heart disease by magnetic resonance spectroscopy. Heart Metab 2006;32:18-21.
van der Knaap MS, van der Grond J, van Rijen PC, et al. Age-dependent changes in localized proton and phosphorus MR spectroscopy of the brain. Radiology 1990; 176:509-515. (shows how PMEs are very large at birth and declines with age)
Related Questions
What peaks are seen in the ³¹P spectrum and what do they mean?
What peaks are seen in the ³¹P spectrum and what do they mean?


