In brief for most tissues, T1 increases and T2 doesn't change very much as field strength increases. This can be understood by reviewing the principles underlying dipole-dipole interactions, the primary mechanism responsible for T1 and T2 relaxation rates for ¹H nuclei.
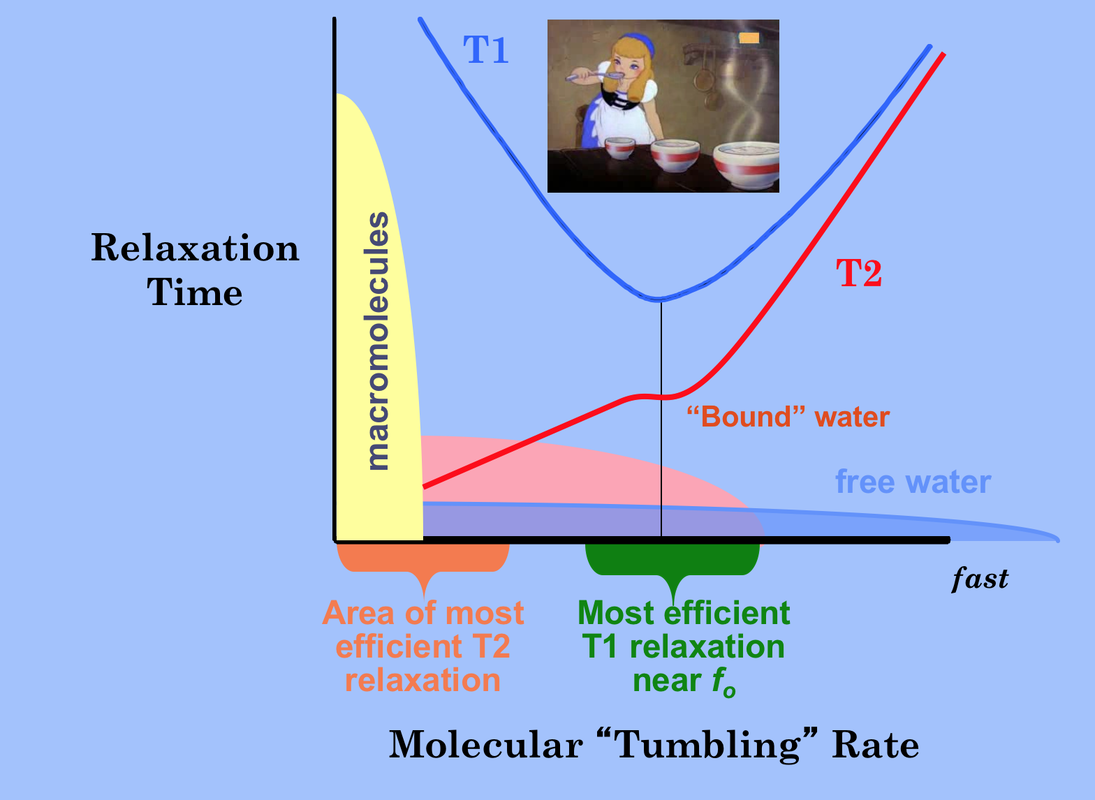
T1 is the shortest when the molecular tumbling rate (also known as the correlation time τc), is approximately equal to the Larmor frequency. Molecules tumbling faster or slower are less efficient at spin-lattice relaxation and have longer T1s.
T2 relaxation accompanies all T1 relaxation processes. Additionally, T2 occurs in a secular fashion (without T1 or energy exchange) when molecular motion slows to well below the Larmor frequency. Hence solids, macromolecules, and bound water molecules rotate slowly and have short T2 values. T2 progressively increases with molecular tumbling rate. In the limit (pure liquids like CSF) T1=T2 and both are several seconds in length.
|
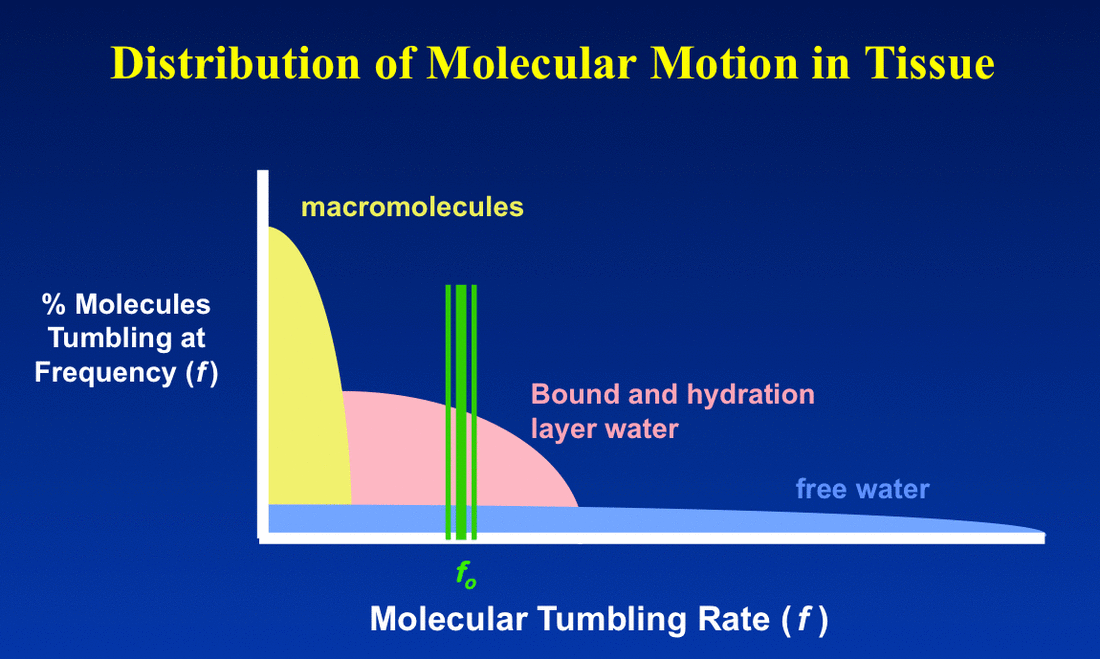
The overall T1 effect can be thought of as a "Goldilock's" phenomenon. For the shortest T1 possible, the molecular rotation rate must be neither "too long" nor "too short", but "just right." Free water has a wide range of tumbling rates and so most molecules in this state are inefficient at T1 relaxation. Hence free water has long T1 values. Water in hydration layers around proteins is more restricted and a significantly greater fraction of ¹H nuclei rotate near the Larmor frequency with correspondingly shorter T1 values.
|
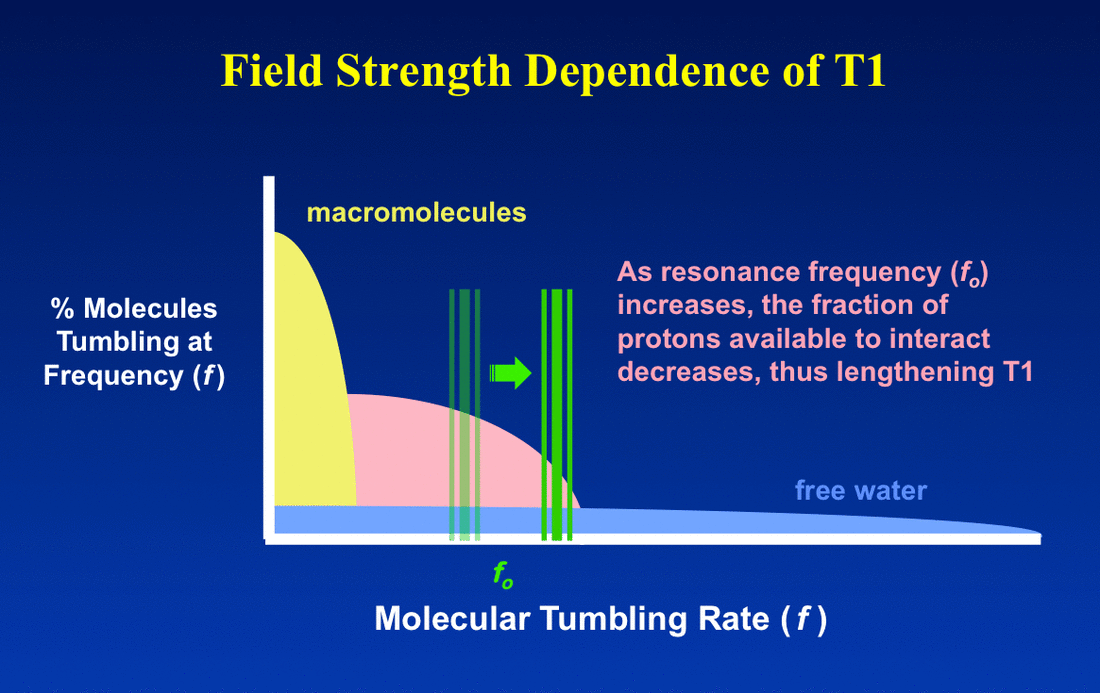
The Larmor frequency is directly proportional to field strength (Bo), so changing the field strength changes the Goldilock "T1 sweet spot". But this affects different substances differently.
For protons in highly mobile molecules (such as free water), changing field strength (and hence the Larmor frequency) will not appreciably alter the fraction of protons moving at this frequency. Thus neither T1 nor T2 will be much affected, at least over the range of fields used for MR imaging.
For protons in highly mobile molecules (such as free water), changing field strength (and hence the Larmor frequency) will not appreciably alter the fraction of protons moving at this frequency. Thus neither T1 nor T2 will be much affected, at least over the range of fields used for MR imaging.
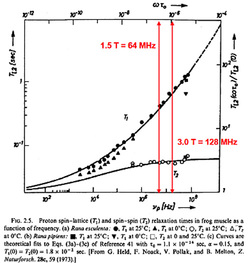
For protons in molecules with intermediate or low mobility, however, shifting the magnetic field to a higher value may significantly decrease the fraction of these protons able to interact at the new (higher) Larmor frequency. As a result, T1 will increase as field strength increases. For most biological tissues, empirical measurements suggest that T1 increases approximately as Bo1/3. Therefore, measured T1 values of most tissues will approximately double as field strength is raised from 0.3 T to 3.0 T and will increase by about 25% between 1.5T to 3.0T.
|
T2 relaxation resulting from static or slowly fluctuating fields will not be much affected by a shift of the Larmor frequency. T2 relaxation in intermediate and low mobility protons accompanying T1 relaxation will be somewhat prolonged by an increase in field strength, paralleling the lengthening of T1. On the other hand, some mechanisms of T2 relaxation (such as chemical exchange and molecular diffusion) may actually be more efficient at higher fields and therefore cause a reduction in T2 values. This is especially seen at 7.0T in the brain near structures (like the substantia nigra) that contain large amounts of iron. Averaging the results among all tissue types it can be concluded that T2 doesn't really change much over the range of field strengths used for routine clinical MR imaging (0.2T to 3.0T) but does shorten at very high fields.
|
Advanced Discussion (show/hide)»
At very high fields (7.0T and above) T2 values of most tissues have been noted to substantially decrease. This is not explained by the dipole-dipole interaction model of Bloembergen Purcell and Pound, which predicts field independence for T2. It is believed that this T2 shortening at very high fields results from microscopic diffusion and susceptibility effects that are accentuated at higher fields. The actual measured T2 values vary depending on the particular tissue and the pulse sequences used. In particular, T2 measurements with ultrashort TE's do not exhibit such dramatic shortening with increasing field strength presumably because the microscopic diffusion effects are mitigated.
References
Bottomley PA, Foster TH, Argersinger RE, Pfeifer LM. A review of normal tissue hydrogen relaxation times and relaxation mechanisms from 1-100 MHz: dependence on tissue type, NMR frequency, temperature, species, excision, and age. Med Phys 1984;11:425-448.
de Graaf RA, Brown PB, McIntyre S, et al. High magnetic field water and metabolite proton T1 and T2 relaxation in rat brain in vivo. Magn Reson Med 2006; 56:386-394. (Measurements at 4.0T, 9.4T, and 11.7T show expected continued rise in T1 values but also 20-50% decreases in T2)
Korb J-P, Bryant RG. Magnetic field dependence of proton spin-lattice relaxation times. Mag Reson Med 2002; 48:21-26.
Rooney WD, Johnson G, Li X, et al. Magnetic field and tissue dependencies of human brain longitudinal ¹H20 relaxation in vivo. Mag Reson Med 2007;57:308-318.
Stanisz GJ, Odrobina EE, Pun J, et al. T1, T2 relaxation and magnetization transfer in tissue at 3T. Magn Reson Med 2005; 54:507-512. (Comparison of a wide range of tissue relaxation times between 1.5T and 3.0T)
Related Questions
Can you explain a little more about the dipole-dipole interaction? I still don't quite understand.
Can you explain a little more about the dipole-dipole interaction? I still don't quite understand.


