|
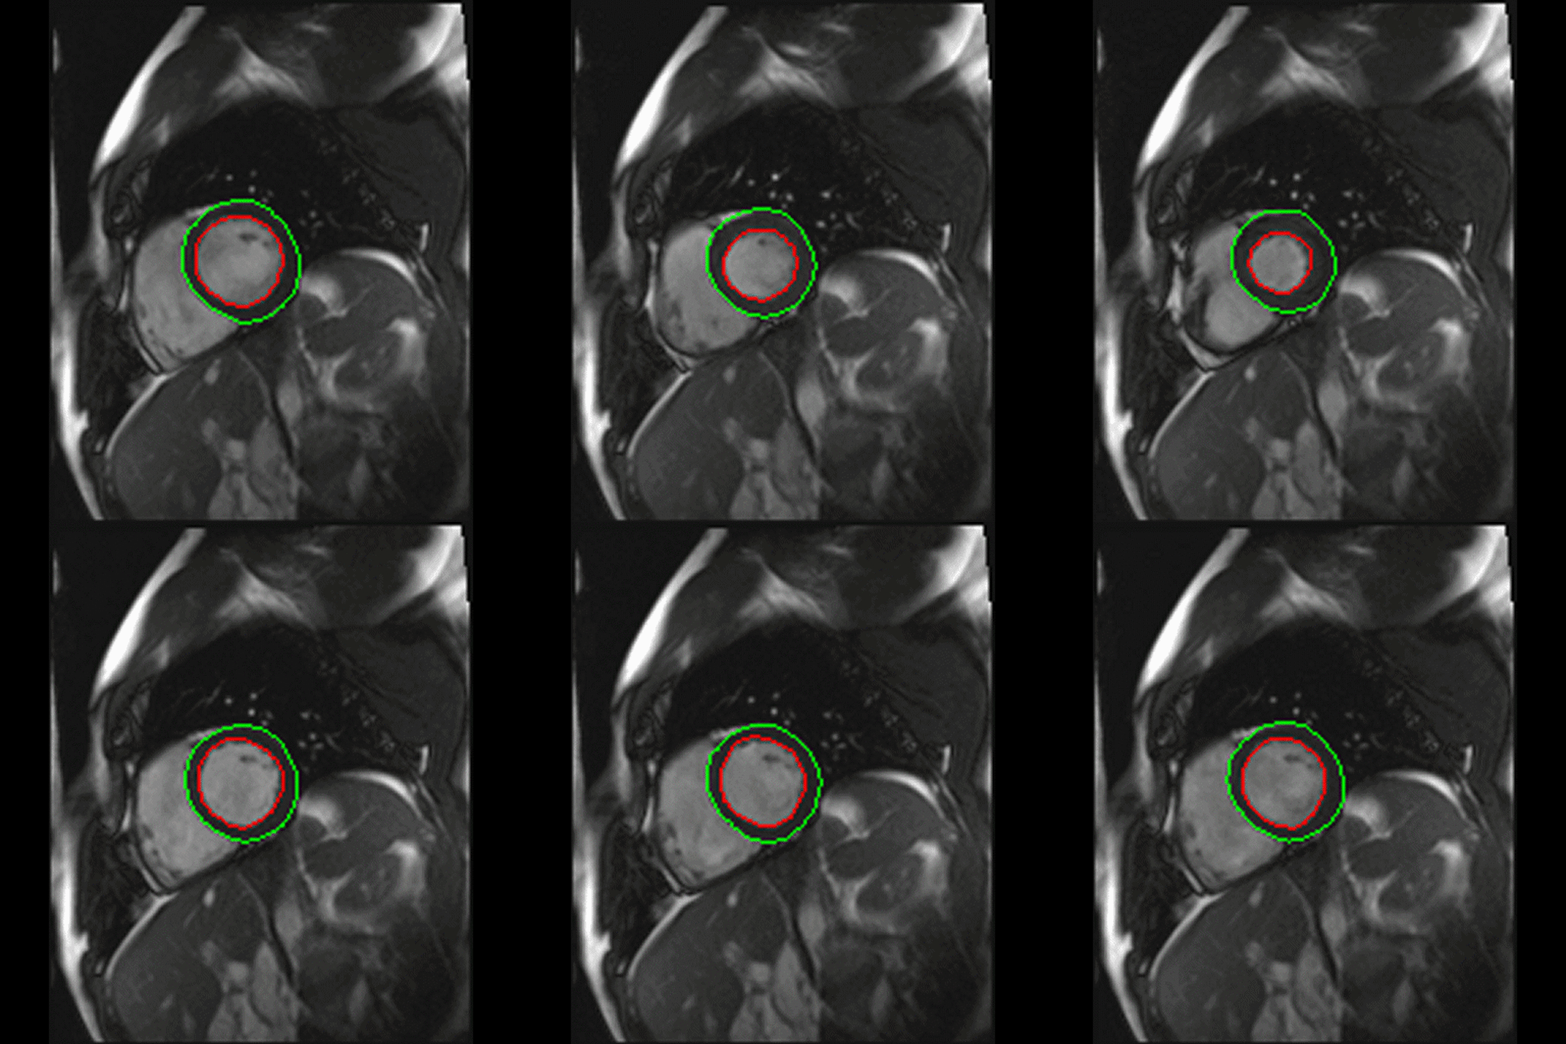
In addition to the visual inspection of cardiac wall motion and thickening on cine studies, quantitative analysis of global ventricular function is also routinely performed at most centers. After downloading data to an independent workstation, technologists trace the inner margins of the myocardium throughout the cardiac cycle. Semiautomated software now exists to assist with this process, but must always be checked by a human for accuracy. The outer myocardial borders may also be traced. The patient's weight and height are entered, allowing normalization of calculated functional parameters to a standard body surface area (BSA) of 1.8 m².
|
- End diastolic volume (EDV) = largest size of ventricular cavity during diastole (relaxation)
- End systolic volume (ESV) = smallest size of ventricular cavity during contraction (systole)
- Stroke volume (SV) = EDV−ESV = volume of blood displaced in 1 heart beat
- Ejection fraction (EF) = SV/EDV = % of blood displaced in 1 heart beat
- Cardiac output (CO) = SV x heart rate = total volume of blood displaced in 1 minute
- Cardiac index (CI) = CO/BSA = cardiac output normalized to body surface area
Advanced Discussion (show/hide)»
As expected, some variability does exist in visually defining the limits and components of the ventricular wall. The first challenge is to decide to what extent papillary muscles and trabeculae are to be included in the ventricular volume measurements. Typically these structures are included because it is easier just to draw an oval regions of interest around the entire intracavitary blood pool (which contains them). Note that it may be difficult in systole to separate the papillary muscles from the myocardial wall as they all appear to coalesce.
A second technical challenge is to decide how many slices to use in the calculation. This may be particularly problematic at the cardiac base where due to cardiac motion portions of the left atrium may appear on the short axis views in systole and but only the left ventricle during diastole. In general, one or two extra slices are needed to measure end diastolic volumes than systolic volumes.
Left ventricular mass can also be calculated by drawing both endocardial and epicardial contours (shown as red and green lines in the cine image above). Most frequently this measurement is done from images obtained at end diastole. Since the density of cardiac muscle is about 1.05 g/mL, the LV mass can be computed as LV myocardial volume x 1.05.
Myocardial %thickening by region can also be computed from these same data and displayed on a polar map ("bull's-eye display") similar to those used for perfusion imaging.
Flett A, Moon J. LV normal volumes calculator. (Requires MS-Excel. Table of normal LV ranges and interactive calculator from London Heart Hospital. Password is 'CMR' to change spreadsheet).
Kawel-Boehm N, Maceira A, Valsangiacomo-Buechel ER, et al. Normal values for cardiovascular magnetic resonance in adults and children. J Cardiovasc Magn Reson 2015; 17:29.
Maceira AM, Prasad SK, Khan M, Pennell DJ. Normalized left ventricular systolic and diastolic function by steady state free precession cardiovascular magnetic resonance. J Cardiovasc Magn Reson 2006; 8:417-426.
Siemens. SCMR Recommended Cardiac MRI Protocols, 2013. Available from this link at Siemens Medical. (Details of LV and RV protocols can be found on pages 8-11).
Walsh TF, Hundley WG. Assessment of ventricular function with cardiovascular magnetic resonance. Cardiol Clin 2007; 25:15-33.
How do they make those movies of the beating heart?


