|
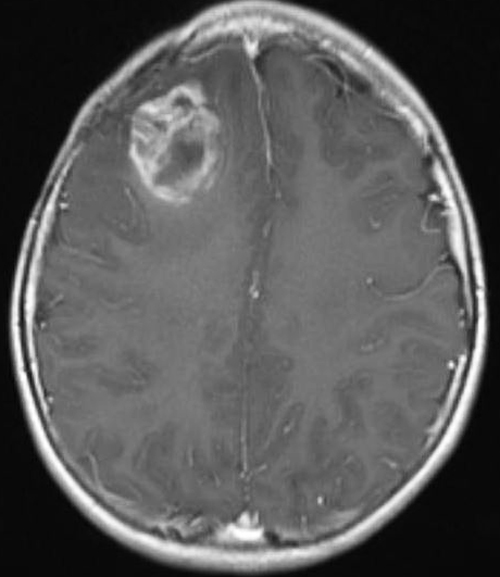
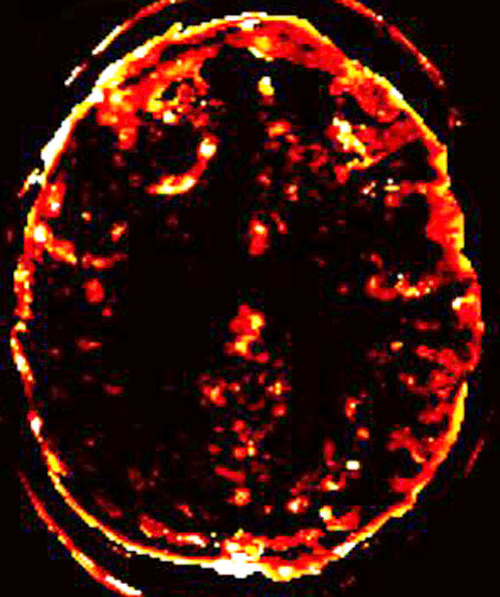
The popular Tofts Model contains four parameters relating to pharmacokinetics of gadolinium in tissue. By mathematical analysis it is possible to measure these parameters and even create anatomic maps of them. But what do these parameters mean in practical terms and how do they correlate with what we observe visually on the dynamic contrast enhanced images?
|
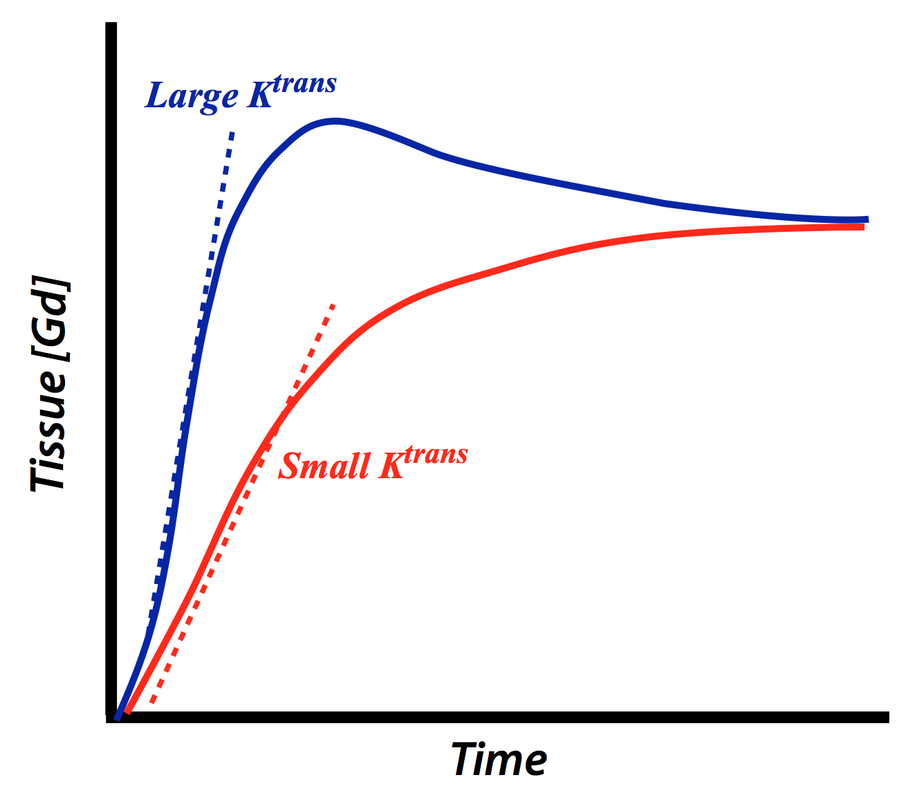
The first and most important DCE parameter is Ktrans, the volume transfer constant for gadolinium between blood plasma and the tissue extravascular extracellular space (EES). Like a chemical reaction rate, its units are given in values of (1/time), such as min−1. In brief, Ktrans reflects the sum of all processes (predominantly blood flow and capillary leakage) that determine the rate of gadolinium influx from plasma into the EES.
The second independent kinetic parameter appearing in the Tofts model is the fractional volume of the EES, denoted ve. It is formally defined as the volume of the EES per unit volume of tissue, and thus is a dimensionless number between 0 and 1. The parameter ve reflects the amount of "room" available within the tissue interstitium for accumulating gadolinium.
The third parameter appearing in the Tofts model is kep, the time constant for gadolinium reflux from the EES back into the vascular system. Recall that kep is not a fully independent parameter, being defined as a ratio of the first two (i.e., kep = Ktrans / ve). So an increase in kep may reflect an increase in Ktrans, a decrease in ve, or both.
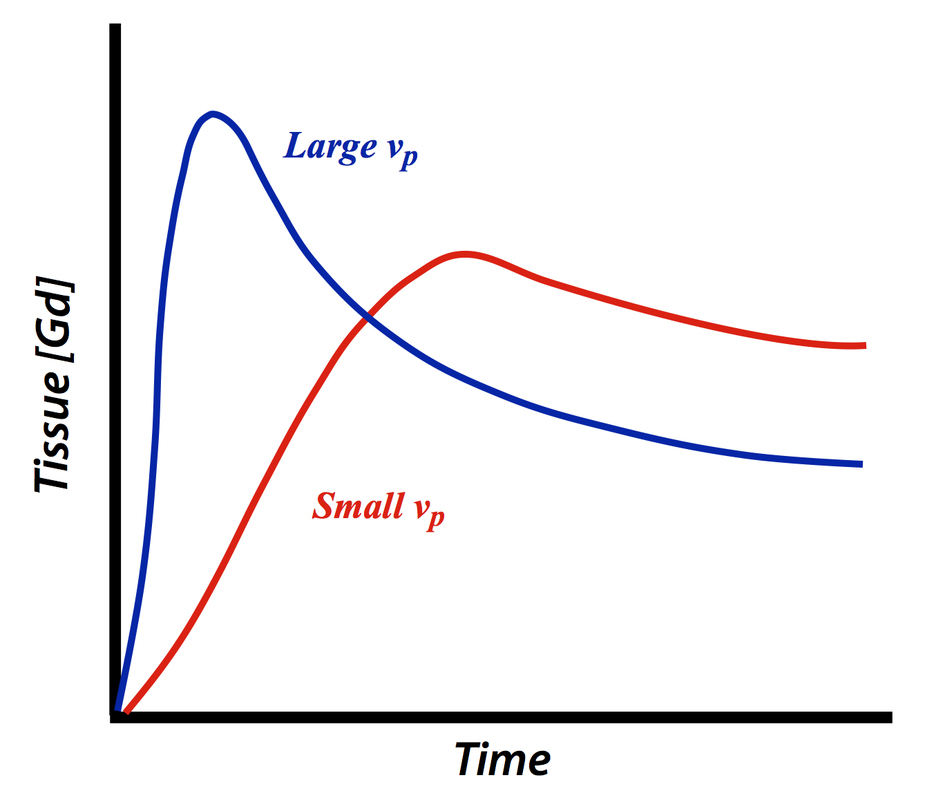
A fourth parameter appearing in the expanded Tofts model is vp, the fractional plasma volume. In many lesions this variable is small and inconsequential. In highly vascular tumors, however, the intravascular contribution to total signal may be 10% or more and cannot be ignored.
A direct connection exists between Ktrans, ve, kep, and vp and the appearance of the signal (concentration) vs time curves of various tissues. Specifically,
- Ktrans correlates with the initial slope ("wash-in" rate) of the time-intensity curve
- ve correlates with the peak height and with time-to-peak (TTP) of the time-intensity curve
- kep controls the shape of the curve, reflected in the relative contributions of its independent components Ktrans and ve
- vp, when small, has little effect on the curves, but when large, results in a faster upslope, higher and earlier peak height, and faster washout of contrast, having more resemblance to the arterial input function.
Advanced Discussion (show/hide)»
Ferrier MC, Sarin H, Fung SH, et al. Validation of dynamic contrast-enhanced magnetic resonance imaging-derived vascular permeability measurements using quantitative autoradiography in the RG2 rat brain tumor model. Neoplasia 2007; 9:546-555. (Good correlation between Ktrans and autoradiographically measured influx rate in a rat glioma model with high permeability).
Tofts PS. T1-weighted DCE imaging concepts: modelling, acquisition and analysis. MAGNETOM Flash 2010; 3:30-35.


