The data to fill k-space is taken directly from the MR signal. Because gradients have been applied for phase and frequency encoding, the MR signal is already in a Fourier-like format suitable for filling the k-space matrix.
|
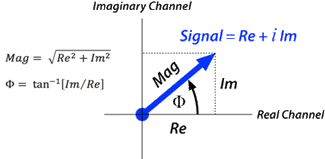
In a prior Q&A we explained how the MR signal is detected in quadrature. Each digitized data point of the MR signal can be represented as a complex number, with real and imaginary components. Alternatively, each data point can be defined as having a magnitude and phase, computed by simple trigonometric relations.
|
The data to fill k-space is taken directly from the MR signal but can be acquired in any order. The dominant method for filling k-space over the last 30 years has been the line-by-line Cartesian method. Today spiral and radially oriented trajectories are becoming more popular.
In the Cartesian method each digitized echo completely fills a line of k-space. The echo signal is recorded in quadrature, so each k-space point contains real and imaginary components. The k-space values on the left side of each row are obtained early in the evolution of the echo, while those on the right side are obtained later. The center of the echo (and hence largest values) occur near the middle of each row of k-space.
In the Cartesian method each digitized echo completely fills a line of k-space. The echo signal is recorded in quadrature, so each k-space point contains real and imaginary components. The k-space values on the left side of each row are obtained early in the evolution of the echo, while those on the right side are obtained later. The center of the echo (and hence largest values) occur near the middle of each row of k-space.
In 2DFT imaging, each row in k-space corresponds to the echo data obtained from a single application of the phase-encoding gradient. By convention, rows near the center of the k-space grid are defined to correspond to low-order phase-encode steps, whereas those rows near the top and bottom correspond to higher-order phase-encodings. Since echo amplitudes are larger at the low-order phase-encode steps (there is less gradient-induced dephasing), the values of k-space will be greater near the center of the grid.
Advanced Discussion (show/hide)»
No supplementary material yet. Check back soon!
References
Mezrich R. A perspective on k-space. Radiology 1995; 195: 297-315. [review].
Miller K. MRI image formation (ppt). On-line lecture notes available at users.fmrib.ox.ac.uk/~karla/teaching/image_formation.ppt
Mezrich R. A perspective on k-space. Radiology 1995; 195: 297-315. [review].
Miller K. MRI image formation (ppt). On-line lecture notes available at users.fmrib.ox.ac.uk/~karla/teaching/image_formation.ppt
Related Questions
What is k-space?
I don't understand how you can simply plug the digitized MR signal data directly into k-space. How are these points the same as spatial frequency?
What is k-space?
I don't understand how you can simply plug the digitized MR signal data directly into k-space. How are these points the same as spatial frequency?


