Understanding the MR appearance of hemorrhage is indeed complicated, but manageable if broken down into its individual components. Only a brief overview will be provided here. Subsequent Q&As will offer expansion and reinforcement of each subtopic in detail.
Composition of Blood and Hematomas
Circulating blood is composed of liquid and cellular elements. Plasma, the liquid portion, is mostly water, and thus has relatively long T1 and T2 values. The cellular elements are mainly erythrocytes (red blood cells, RBCs) containing hemoglobin (Hb), the iron-based macromolecules responsible for oxygen transport. The magnetic properties of Hb derivatives provide the dominant mechanism of MR image contrast at magnetic fields of 0.5T and greater.
Hemorrhage is the escape of blood from vessels into surrounding tissues. A discrete collection of clotted blood is known as a hematoma. The microstructure of a hematoma also affects its MR imaging characteristics, a phenomenon important at field strengths below 0.5T.
|
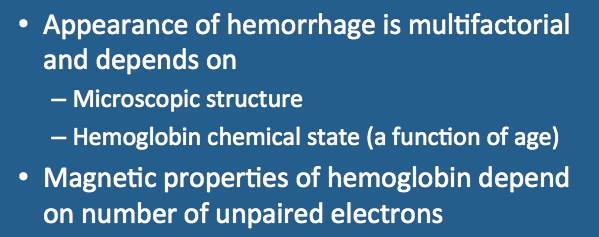
Histologically, an acute hematoma consists of RBCs trapped in a matrix of fibrin interspersed with small pools of serum. This microscopic heterogeneity and clumping of RBCs results in spin dephasing, loss of signal on T2/T2*-weighted images, and restricted diffusion of water molecules. A hematoma is embedded within, and often intermixed with, tissue or fluid from its site of origin. The final MR appearance is thus a weighted sum of contributions from the hematoma itself as well as background tissues.
|
|
Hemoglobin and its Derivatives
Hemoglobin is comprised of four subunits, each containing a heme group with an iron (Fe) atom nestled at its center. Each Fe center has one free coordination site to which oxygen and other small molecules may transiently bind.
Molecular binding creates conformational changes in the Hb molecule and alters its electronic configuration. This, in turn, effects its MR imaging properties, especially at high fields. Four different hemoglobin species are commonly recognized: oxyhemoglobin (oxy-Hb), deoxyhemoglobin (deoxy-Hb), methemoglobin (met-Hb), and hemichromes, whose structures appear below.
|
|
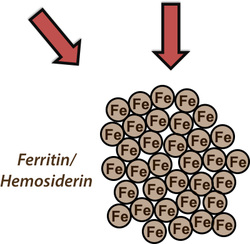
These hemoglobin species typically evolve in the order shown over the first 1-2 weeks after initial hematoma formation. Ultimately, the hemoglobin molecule is enzymatically cleaved into multiple small fragments. Iron atoms are released, but coalesce by the thousands into large, chunky metallo-protein complexes known as ferritin and hemosiderin. Ferritin and hemosiderin are engulfed by invading macrophages and ultimately
deposit along the walls of old hematoma cavities.
|
The hemoglobin species above have different electronic structures, resulting in different magnetic susceptibilities (χ). Oxy-Hb and hemichromes have no unpaired electrons and are weakly diamagnetic. Deoxy-Hb and met-Hb have 4 and 5 unpaired electrons per iron atom respectively and are paramagnetic. Ferritin and hemosiderin form superparamagnetic particles with extremely high magnetic susceptibilities.
Evolution of Hematomas on MRI
Most of the published literature on the MR imaging of hemorrhage is focused on intracerebral hematomas at high fields (1.5T or higher). These are usually classified by the time frame over which the dominant hemoglobin species is manifest: hyperacute, acute, early subacute, late subacute, and chronic. A summary of imaging finding for each time frame is given below.
|
Hyperacute Hematoma
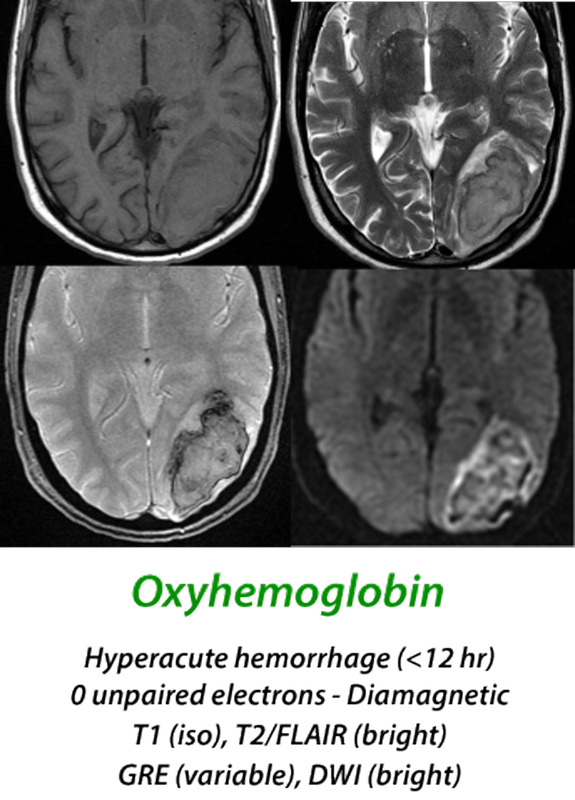
(< 12 hours) When arterial blood extravasates to form a hyperacute hematoma, over 95% of the hemoglobin is in the oxyhemoglobin (oxy-Hb) state. Oxy-Hb has no unpaired electrons, and like most tissues, is weakly diamagnetic. At this stage the MR signal is primarily determined by the microstructural properties of the clot rather than magnetic effects of hemoglobin, with isointensity on T1-weighted images and slight hyperintensity on T2-weighted images. Diffusion is restricted in the center of the clot due to increase in viscosity and reduction in extracellular space secondary to packed erythrocytes.
|
Acute Hematoma
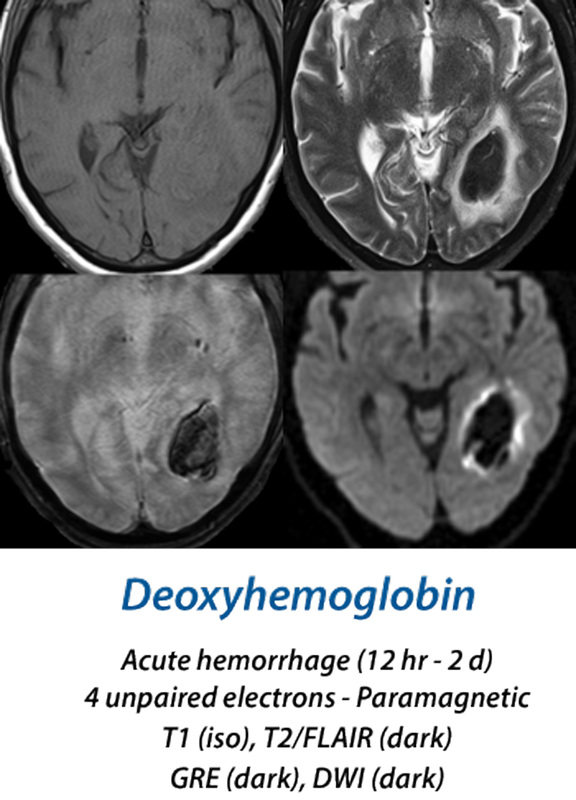
(12 hours - 2 days) Within a few hours, oxygen begins to to dissociate from the clot's hemoglobin, with increasing formation of deoxyhemoglobin (deoxy-Hb). This begins at the periphery of the hematoma and gradually spreads inward. Deoxy-Hb, with 4 unpaired electrons per iron atom, is strongly paramagnetic. Because the deoxy-Hb remains concentrated within RBCs, it produces susceptibility-induced distortions of the local magnetic fields, resulting in dephasing and loss of signal on T2/T2*-weighted images. T1 images remain iso-intense in both the hyperacute and acute stages.
|
Early Subacute Hematoma
(2 days - 1 week) Methemoglobin (met-Hb) has 5 unpaired electrons and is even more paramagnetic than its precursor, deoxy-Hb. The configuration of the molecule as a result of iron being in the ferric [Fe(III)] state allows access of water very close to the iron center for the very first time. This allows so-called inner sphere relaxation to occur, resulting in very short T1 values (and corresponding brightness on T1-weighted images). Because met-Hb continues to be compartmentalized intracellularly, however, local magnetic susceptibility effects persist and the hematoma remains dark on T2/T2*-weighted images.
|
|
Late Subacute Hematoma
(1 week - 2 months) Late in the first week lysis of RBCs occurs and met-Hb now spills into the extracellular space. The release of met-Hb from its intracellular compartment eliminates the local susceptibility-induced T2/T2* dephasing, so its signal now becomes bright on T2-weighted images. The molecule itself remains intact, with 5 unpaired electrons, inner-sphere bonding of water and high signal on T1-weighted images.
|
Chronic Hematoma
(> 2 months) The final stages of hemoglobin degradation include transformation to hemichromes that have lost all paramagnetic properties. Hemichromes, along with other protein fragments and hemoglobin breakdown products are dissolved/suspended in water (with long T1 and T2 values) in the central residual cavity of the old hematoma. Around the periphery of the cavity, thousands of iron atoms are scavenged by macrophages and glial cells into aggregates know as ferritin and hemosiderin. Ferritin and hemosiderin are superparamagnetic, with powerful susceptibility effects resulting in marked shortening of T2 and T2* along the walls of the old hematoma cavity.
|
|
Mnemonic devices may be useful to help recall the signal changes at different times after hemorrhage. Although I do not use these myself, I feel obligated to report one that is in common use among US Radiology residents, originated by my colleague Jim Smirniotopoulos:
|
Important Note: The discussion above primarily applies to higher field (≥ 0.5 T) systems where imaging findings are dominated by the paramagnetic effects of hemoglobin. At low and intermediate fields some important differences in imaging appearances are noted. See this Q&A for a more detailed analysis.
Advanced Discussion (show/hide)»
The "Iddy Biddy Baby" mnemonic confuses signals at the center from the periphery of chronic hematomas. The center of chronic hematomas usually have high water content, rendering them bright, not dark, on T2-weighted images. The periphery of chronic hematomas contain hemosiderin, rendering them slightly dark on T2-weighted images but profoundly dark on T2*/SW images.
Quick Quiz: Do you remember the difference between plasma and serum?
Answer: Serum is plasma with fibrinogen and other clotting factors removed.
References
Alemany Ripoll M, Stenborg A, Sonninen P, et al. Detection and appearance of intraparenchymal haematomas of the brain at 1.5T with spin-echo, FLAIR and GE sequences: poor relationship to the age of the haematoma. Neuroradiology 2004; 46:435-443. (Demonstrates considerable variability in hematoma evolution may exist, not matching the "classic" patterns).
Allkemper T, Tombach B, Schwindt W, et al. Acute and subacute intracerebral hemorrhages: comparison of MR imaging at 1.5 and 3.0 T–initial experience. Radiology 2004; 232:874–81.
Bradley WG Jr. MR appearance of hemorrhage in the brain. Radiology 1993; 189:15-26.
Brooks RA, Di Chiro G, Patronas N. MR imaging of cerebral hematomas at different field strengths: theory and applications. J Comput Assist Tomogr 1989; 13:194-206.
Clark RA, Watanabe AT, Bradley WG Jr, Roberts JD. Acute hematomas: effects of deoxygenation,
hematocrit, and fibrin-clot formation and retraction on T2 shortening. Radiology 1990; 175:201–206. Gomori JM, Grossman RI. Mechanisms responsible for the MR appearance and evolution of intracranial hemorrhage. Radiographics 1988; 8:427-440.
Gomori JM, Grossman RI, Yu-Ip C, Asakura T. NMR relaxation times of blood: dependence on field strength, oxidation state, and cell integrity. J Comput Assist Tomogr 1987; 11:684-690.
Hayman LA, Taber KH, Ford JJ, Bryan RN. Mechanisms of MR signal alteration by
acute intracerebral blood: old concepts and new theories. AJNR Am J Neuroradiol 1991; 12:899–907.
Kang BK, Na DG, Ryoo JW, et al. Diffusion-weighted MR imaging of intracerebral hemorrhage. Korean J Radiol 2001; 2:183-191.
Kidwell CS, Wintermark M. Imaging of intracranial haemorrhage. Lancet Neurol 2008; 7:256-67.
Morita N, Harada M, Yoneda K, et al. A characteristic feature of acute haematomas in the brain on echo-planar diffusion-weighted imaging. Neuroradiology 2002; 44:907-911.
Silvera S, Oppenheim C, Touzé E, et al. Spontaneous intracerebral hematoma on diffusion-weighted images: influence of T2-shine-through and T2-blackout effects. AJNR Am J Neuroradiol 2005; 26:236-241.
Vidmar J, Sersa I, Kralj E, et al. Discrimination between red blood cell and platelet components of blood clots by MR microscopy. Eur Biophy J 2008; 37:1235-40. (Areas of clots rich in platelets and high hematocrit >80% RBC have shorter T1 values.)
Yimaz A, Ulak FS, Batun MS. Proton T1 and T2 relaxivities of serum proteins. Magn Reson Imaging 2004; 22:683-688.
Related Questions
How does the appearance of subarachnoid hemorrhage differ from parenchymal hemorrhage on MRI?
What are the different forms of hemoglobin and why do they have different magnetic properties?
How does the MR appearance of blood differ at low and very low magnetic fields?
How does the appearance of subarachnoid hemorrhage differ from parenchymal hemorrhage on MRI?
What are the different forms of hemoglobin and why do they have different magnetic properties?
How does the MR appearance of blood differ at low and very low magnetic fields?


