Note: In this Q&A we adopt the convention that substances "bright" on T1-weighed images have short T1 values. This is true for most (but not all) pulse sequences. For a detailed explanation, click here.
I know that cholesterol is mentioned in the vast majority of MR books, papers, and websites as a cause for high signal on T1-weighted images. Although there may be some occasional situations where this occurs, for the most part other explanations are more reasonable. I believe that on the whole T1 brightening due to cholesterol has been far overstated. To justify my claim, a short overview is required.

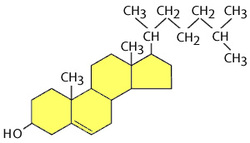
Cholesterol is an organic lipid that serves as an important structural component of cell membranes and a precursor for steroid hormones, bile acids, and vitamin D. It is found ubiquitously throughout the body, with higher concentrations in blood, fat, liver, and adrenals. Its concentration in adipose tissue is small (only 1mg/g) and outnumbered a thousand-fold by other triglycerides. Nevertheless, fat constitutes one of the body's largest cholesterol pools where it is stored in the central oil droplet of the adipocyte.
The deposition of cholesterol in the walls of vessels has been a topic of extensive scientific investigation over the last several decades. As such, a wealth of MRI and MRS data concerning cholesterol derives directly from research on atherosclerotic plaques. This body of knowledge reveals that cholesterol exists in several forms and states, each with different imaging characteristics.
At body temperatures, atherosclerotic plaque lipids are simultaneously present in an isotropic liquid state (cholesteryl esters and triglycerides), liquid crystalline state (phospholipid/cholesterol bilayers), and solid state (cholesterol crystals). The narrow-line MRS signals from plaque arise predominantly from the liquid lipid phase (mostly cholesterol esters). Cholesterol in all its states has a short T1 value and range of chemical shifts similar to other lipids. The T2 values of cholesterol, however, differ significantly according to state.
Liquid cholesterol esters have fairly short T2 values (~5-10 msec), but these times are long enough to be detectable/imageable by routine MRI. By contrast, the solid and crystalline forms of cholesterol associated with cell membranes have extremely short T2 times (measured in microseconds); their signals decay too quickly for detection using routine MR techniques.
|
Cholesterol-containing atheromatous plaques. The earliest MR investigations into the imaging of atherosclerotic plaque were focused on detecting these short T1 cholesterol and lipid components. It was soon recognized, however, that non-hemorrhagic plaques were not particularly bright on T1-weighted images. The reason for this is that water content in the atheromatous core is 10x higher than lipid, thus dominating the MR signal. Only in recent years have advanced techniques (including diffusion and water suppression methods) allowed some headway to be made into detecting and imaging these lipid components.
|
|
Craniopharygiomas frequently contain high T1 signal cystic areas, and it is common to hear or read that cholesterol is at least partially responsible for this. Indeed, these cysts often do contain large amounts of cholesterol which surgeons can see as golden flecks floating on a sea of "motor-oil" colored fluid. In 1992 Ahmadi et al compared the MR appearance to cyst content in 10 cases and showed that the T1 signal was unrelated to cholesterol or lipid content. Instead, the short T1 seen in craniopharyngiomas is likely due to high protein content, blood products (methemoglobin), or both.
|
|
Cholesterol granulomas are uncommon lesions that typically occur at the apex of the petrous temporal bone. These lesions are characteristically bright on T1-weighted images and do contain very high concentrations of cholesterol. However, the cholesterol they contain is not a liquid ester, but is crystalline (with T2 values so short as to render their signals undetectable). Further proof that lipids are not responsible for the MR appearance is that these lesions do not have a surrounding chemical shift artifact nor suppress with fat saturation pulses. The high T1 signal is instead due to the paramagnetic effects of blood products characteristically associated with these lesions.
|
Outside the central nervous system and vascular system it is likewise difficult to find well documented examples of cholesterol alone causing definitive T1 shortening. Clear cell renal carcinoma is a common somatic tumor known to contain moderately large levels of cholesterol but these tumors are seldom bright on T1-weighted images. It is possible that chemical shift imaging may detect lipids within them, but even if true, these tumors also contain triglycerides and free fatty acids so there is no proof that cholesterol is the principal moiety responsible for this behavior.
|
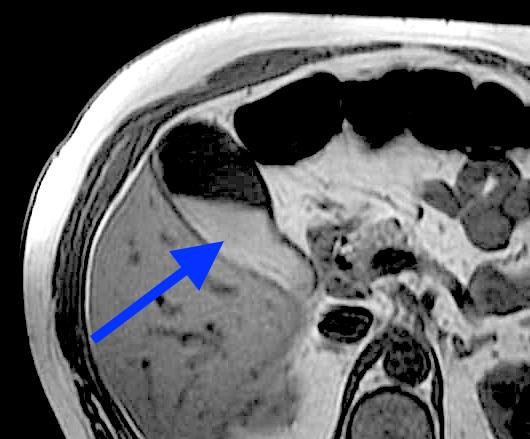
Biliary cholesterol is often cited as the reason concentrated bile and gallbladder sludge appears bright on T1-weighted images. However, several ¹H MR spectroscopy studies have shown that nearly all of the MR signal in bile comes from water, not lipid protons. Additionally, the molar percent cholesterol actually decreases by about 40% between dilute and fully concentrated bile, presumably due to reabsorption in the gallbladder wall. Mucin is often present in high concentration in biliary sludge, so water-macromolecular interactions with mucin is more likely responsible for the high T1 signal.
|
Cholesterol polyps of the gallbladder, although hard to see because of their small size, are often hyperintense on T1-weighted images. Pathologically they consist of fat-laden macrophages and foam cells. Although they contain liquid crystal forms of cholesteryl esters and cholesterol precursors, they also contain abundant triglycerides which may explain the T1 shortening observed.
Cholesterol gallstones serve as a final example, which are well known to have low signal on both T1 and T2 weighted images. This is because the cholesterol in gallstones is in a solid state, with very short T2 values. A bright gallstone on T1-weighted images is therefore most likely a pigment stone, whose T1 is shortened by water interaction with its mucin-glycoprotein matrix.
Cholesterol gallstones serve as a final example, which are well known to have low signal on both T1 and T2 weighted images. This is because the cholesterol in gallstones is in a solid state, with very short T2 values. A bright gallstone on T1-weighted images is therefore most likely a pigment stone, whose T1 is shortened by water interaction with its mucin-glycoprotein matrix.
Advanced Discussion (show/hide)»
A few random additional comments. . .
The structure and characteristics of solid crystalline forms of cholesterol have been investigated, but using ex vivo techniques of solid state NMR including magic angle spinning (MAS).
Cholesteatomas, in spite of their name, do not contain cholesterol.
Colloid cysts are often T1-bright and some do contain cholesterol. However, they also frequently contain mucin, blood products, and other lipids, so the role of cholesterol remains in doubt.
Other cholesterol-containing tumors include hepatocellular carcinoma and pancreatic acinar cell carcinoma. Neither is bright on T1-weighted images.
References
Ahmadi J, Destian S, Apuzzo MLJ, et al. Cystic fluid in craniopharygiomas: MR imaging and quantitative analysis. Radiology 1992; 182:783-785.
Choudhury RP, Fuster V, Badimon JJ, et al. MRI and characterization of atherosclerotic plaque. Emerging applications and molecular imaging. Arterioscler Thromb Vasc Biol 2002;22:1065-1074.
Demas BE, Hricak H, Moseley M, et al. Gallbladder bile: an experimental study in dogs using MR imaging and proton MR spectroscopy. Radiology 1985; 157:453-455.
Ginsburg GS, Atkinson D, Small DM. Physical properties of cholesteryl esters. Prog Lipid Res 1984; 23:135-167.
Pearlman JD, Zajicek J, Merickel MB, et al. High-resolution ¹H NMR spectral signature from human atheroma. Magn Reson Med 1988;7:262-279.
Schiffman ML, Sugerman HJ, Moore EW. Human gallbladder mucosal function: effect of concentration and acidification of bile on cholesterol and calcium solubility. Gastroenterology 1990; 99:1452-1459. [DOI LINK]
Toussaint J-F, LaMuraglia GM, Southern JF, et al. Magnetic resonance images lipid, fibrous, calcified, hemorrhagic, and thrombotic components of human atherosclerosis in vivo (full text link). Circulation 1996; 94:932-938.
Tsai H-M, Lin X-Z, Chen C-Y et al. MRI of gallstones with different compositions. AJR 2004;182:1513-1519.
Wennmacker SZ, de Savornin Lohman EAJ, de Reuver PR, et al. Imaging based flowchart for gallbladder polyp evaluation. J Med Imaging Rad Sci 2021; 52:68-78. [DOI LINK]
Related Questions
What is T1 relaxation?
Can you explain a little more about the dipole-dipole interaction? I still don't quite understand.
What is T1 relaxation?
Can you explain a little more about the dipole-dipole interaction? I still don't quite understand.


