Data Pre-Processing
Pre-processing of RS-fMRI images is similar to that of standard fMRI studies as described in a prior Q&A. These steps include slice-timing correction, motion compensation, spatial filtering, and normalization. Temporal filtering to remove noise must be done judiciously so as not to remove relevant low-frequency resting state signals.
Noise levels from motion and physiologic sources in RS-fMRI are very high; less that 5% of total signal derives from neuronal activity. Respiratory and cardiac pulsations contain frequencies close to those of resting state networks and are much more problematic for RS-fMRI than for task-based studies. Simultaneous recording of physiologic data such as heart rate, respiratory rate, or end-tidal pCO2 values may be built into the regression models. Masking of signal from ventricles, skull and white matter may also be performed. More controversial techniques applied to RS-fMRI include denoising by autocorrelation methods and removal of the average whole brain signal from the data set (global signal regression). These latter two techniques potentially may introduce or obscure anti-correlations (deactivations) in an experiment.
Correlation Analysis
The degree of temporal synchrony between time-series data obtained from two voxels or brain regions (X = x1, x2, x3, … and Y = y1, y2, y3, …) can be expressed by the correlation coefficient (r)
|
.where r = 0 implies no correlation, r = 1 perfect correlation, and = −1 perfect anti-correlation.
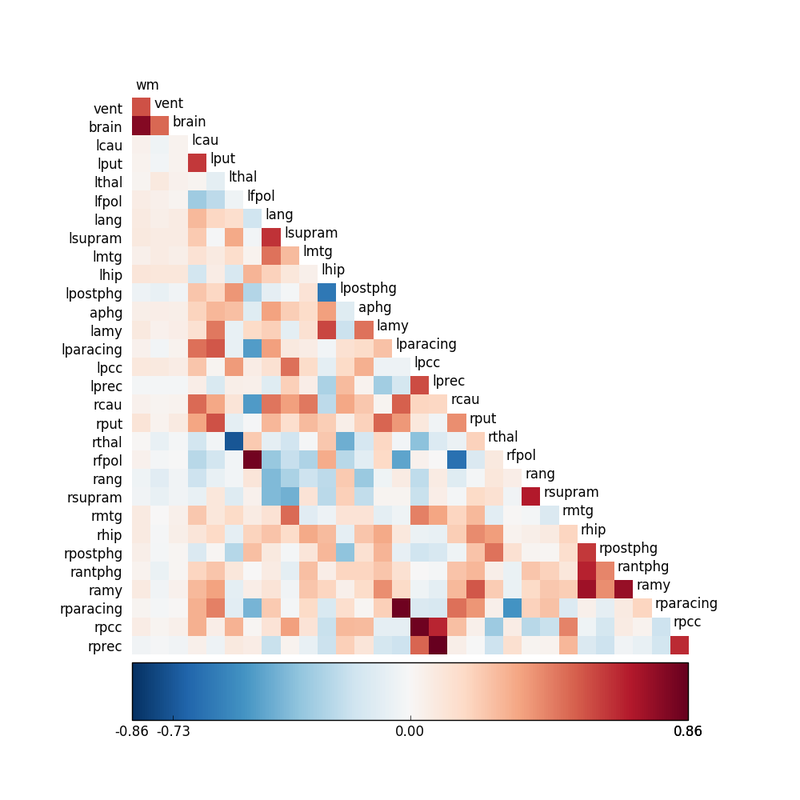
It is possible to perform this calculation for all pairs of voxels in the data set, resulting in over 200,000 comparisons. More frequently a "seed" is chosen (a predetermined voxel, cluster, or small anatomic region) and comparison made to similar seeds in the data set. A seed correlation matrix (shown left) may be constructed, where higher r-values reflect greater connectivity between paired regions. High-correlation areas can also be displayed as "blobs" overlaid on co-registered anatomic images. |
Independent Component Analysis
The goal of Independent Component Analysis (ICA) is to detect underlying patterns present in the fMRI signal without prior knowledge of the experimental task or shape of the hemodynamic response function. ICA is thus considered a “model free” method for blind source signal separation, allowing identification of unknown independent source signals that have been linearly mixed together. For example, ICA methods could be used extract individual voices, music, and noise elements from an audio mixture recorded at a cocktail party without prior knowledge of their sources or locations.
 Spatial ICA separates signals from visual cortex into three components.
As applied to fMRI data, ICA may distinguish meaningful areas of correlated brain activation from random and semi-periodic physiological noise. Although ICA can be used in conjunction with GLM methods for task-based experiments, it has found its most widespread application for the analysis of resting-state fMRI data.
The ICA algorithm begins by constructing a matrix (Y) of all the observed fMRI data. Each column of Y contains sequential time points for a single voxel; each row of Y is the fMRI signal at a certain time point for organized by space (all the voxels). After some pre-processing to normalize means and variances, Y is decomposed into the product of two matrices (T and S), where T is a matrix of time courses and S is a matrix of spatial components. The values in T and S are iteratively adjusted to determine a decomposition that maximizes statistical independence (typically between rows of S). The resultant independent component signals can then be color-coded and overlaid on an anatomic image (above).
The ICA algorithm begins by constructing a matrix (Y) of all the observed fMRI data. Each column of Y contains sequential time points for a single voxel; each row of Y is the fMRI signal at a certain time point for organized by space (all the voxels). After some pre-processing to normalize means and variances, Y is decomposed into the product of two matrices (T and S), where T is a matrix of time courses and S is a matrix of spatial components. The values in T and S are iteratively adjusted to determine a decomposition that maximizes statistical independence (typically between rows of S). The resultant independent component signals can then be color-coded and overlaid on an anatomic image (above).
Other Methods
- Regional Homogeneity (ReHo) measures the similarity of the time series of a given voxel to those of its nearest neighbors, providing information about local connectivity
- Amplitude of Low-Frequency Fluctuations (ALFF) quantifies the intensity of spontaneous low-frequency oscillations in the BOLD signal, which are thought to reflect spontaneous neural activity
- Graph Theory Analysis models the brain as a network of nodes (brain regions) and edges (functional connections), allowing for the calculation of various network metrics such as centrality, clustering, and efficiency.
Software Tools
Several software packages are available for RS-fMRI analysis, including:
- CONN (Functional Connectivity Toolbox): MATLAB-based. Probably the most widely used. Includes preprocessing, denoising, functional connectivity measures, general linear model, and cluster-level inferences modules. [LINK]
- REST (Resting State fMRI Data Analysis Toolkit): From China, original use was for calculating ReHo and ALFF measures; has not been updated in at least 8 years [LINK]
- BRANT (BRAinNetome fmri Toolkit): MATLAB-based, also from China, offers a wide range of image analysis and fMRI processing algorithms. [LINK]
- SPM, FSL, and AFNI: General neuroimaging software packages that include tools for rs-fMRI analysis as well as for task-based fMRI
Advanced Discussion (show/hide)»
Meaningful resting-state fMRI data lies in the frequency range of approximately 0.01 − 0.1 Hz. By comparison, respiratory fluctuations produce aliased signals in the range of 0.1 − 0.3 Hz, while cardiac pulsations produce signals in the range of 0.8 − 1.3 Hz. Thus physiological noise is a much greater problem for RS-fMRI than for task-based studies.
References
Barkhof F, Haller S, Rombout SARB. Resting-state functional MR imaging: a new window to the brain. Radiology 2014; 272:29-49. (good recent review)
Beckman CF. Modelling with independent components. NeuroImage 2012; 62: 891-901.
Bright MG, Murphy K. Removing motion and physiological artifacts from intrinsic BOLD fluctuations using short echo data. NeuroImage 2013; 64:526-537.
Calhoun VD, Adali T, Hasen LK, et al. ICA of functional MRI data: an overview. 4th International Symposium on Independent Component Analysis and Blind Signal Separation, Nara, Japan, 2003:281-288.
Chen JE, Glover GH. Functional magnetic imaging methods. Neuropsychol Rev 2015; 25:289-313.
Hyvärinen A, Oja E. Independent component analysis: algorithms and applications. Neural Networks 2000; 13:411-413. (provides mathematical details of matrix decomposition and optimization for ICA)
Lee MH, Smyser CD, Shimony JS. Resting-state fMRI: a review of methods and clinical applications. AJNR Am J Neuroradiol 2013; 34:1866-72. (good review)
McKeown MJ, Makeig S, Brown GG, et al. Analysis of fMRI data by blind separation into independent spatial components. Hum Brain Mapping 1998; 6:160-188 (first use of ICA for fMRI data, actually a task-based experiment, not RS-fMRI)
Nieto-Castanon, A. (2020). Handbook of functional connectivity Magnetic Resonance Imaging methods in CONN. Hilbert Press, 2020. [DOI LINK]
Power JD, Schlaggar BL, Petersen SE. Studying brain organization via spontaneous fMRI signal. Neuron 2014; 84:681-696. (Good recent review)
Rosazza C, Minati L, Ghielmetti F, et al. Functional connectivity during resting-state functional MR imaging: study of the correspondence between independent component analysis and region-of-
interest-based methods. AJNR Am J Neuroradiol 2012; 33:180–87. (little difference between correlation and ICA methods for normal adults RS-fMRI analysis)
Van Dijk et al. Intrinsic functional connectivity as a tool for human connectomics: theory, properties, and optimization. J Neurophysiol. 2010; 103:297-321.
Related Questions
How do you statistically analyze fMRI data?
What is meant by resting state fMRI? How is it used?
How do you statistically analyze fMRI data?
What is meant by resting state fMRI? How is it used?


