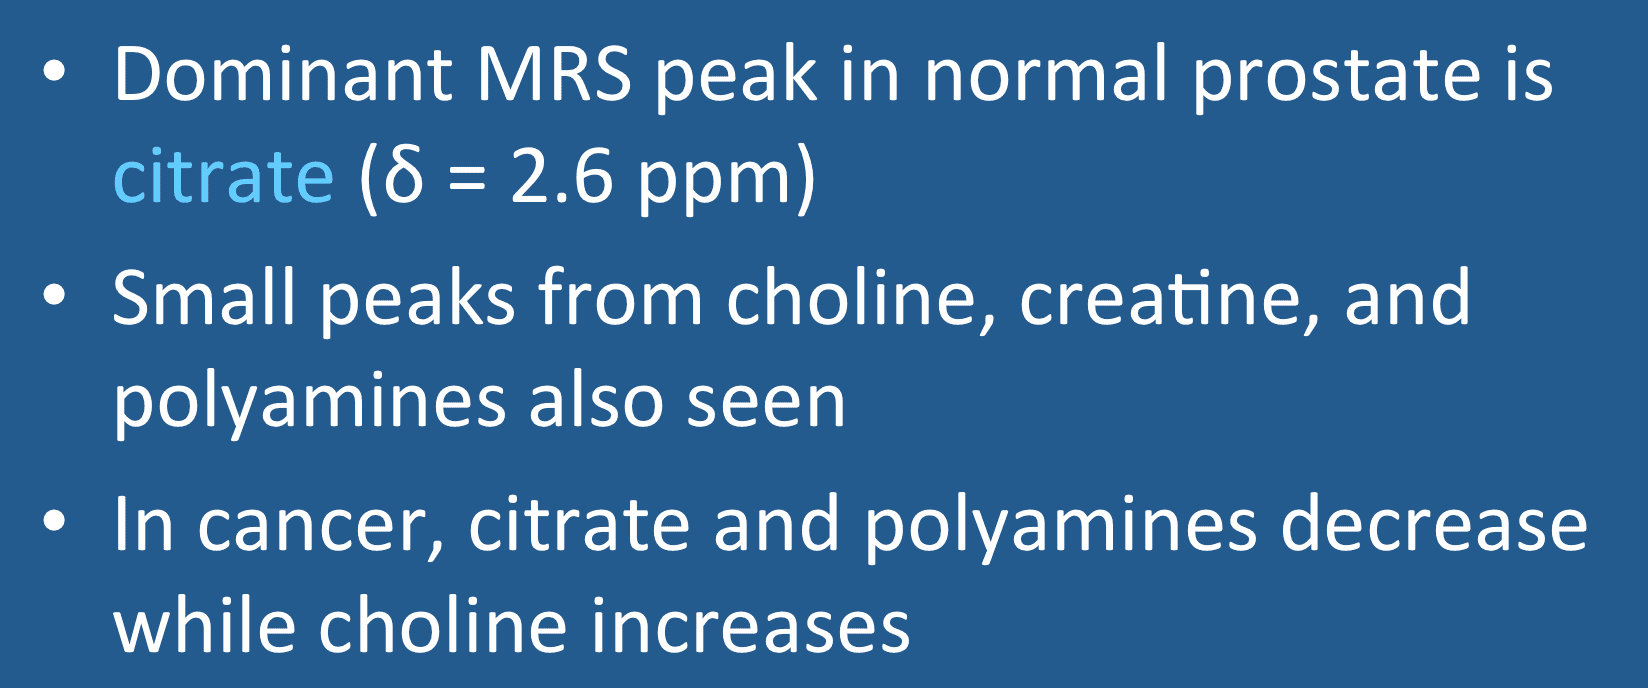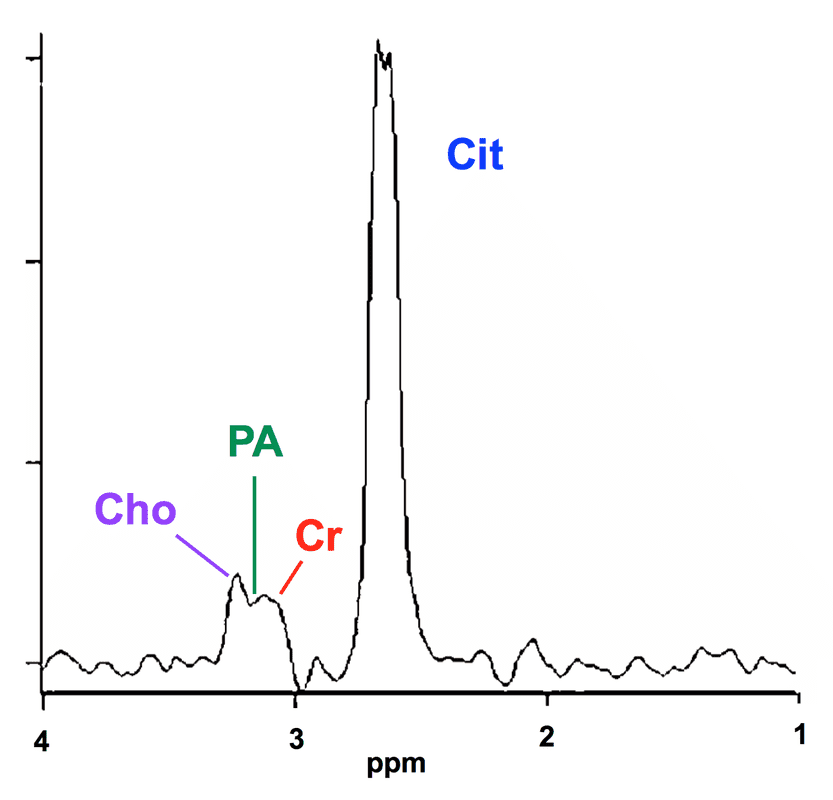
¹H-MRS showing a normal spectrum on the right side of the prostate and cancer on the left. Note the decrease in citrate (Ci) and elevation of choline (Cho) in the cancerous side, with a Jung score = 5. Decrease in polyamines (PA) in cancer also allow better separation of the Cho and Cr peaks to be appreciated. (Modified from Sharma 2014, under CC BY license)
Advanced Discussion (show/hide)»
Citrate is a normal intermediate metabolite of glycolysis in the Krebs (Tricarboxylic Acid) cycle where it is normally converted to isocitrate by the enzyme m-aconitase. Zn+2 anions, present in high concentration in normal prostate, inhibit m-aconitase allowing a build-up of citrate for excretion into the ejaculatory fluid. It is believed that loss of zinc transforms normal citrate-producing cells into citrate-oxidizing malignant cells, providing the bioenergetic basis for prostate cancer.
The polyamine resonance bridging the Cho−Cr interval does not include the most famous of all the polyamines, spermine. Spermine's principal resonance is at δ = 2.7 ppm and is usually hidden by the much larger citrate peak at δ = 2.6.
The spectral splitting seen in citrate is a the classic example of a strongly coupled (AB) system. By contrast most other organic metabolites we have studied (such as lactate) are considered weakly coupled (AX) systems. In weakly coupled systems the chemical shift difference in Hz (Δν) between the two protons is large compared to the coupling (J) between them. In strongly coupled systems, the chemical shift and coupling values are comparable. For citrate at 3.0T the chemical shift difference (Δν) = 19 Hz while J = 15.5 Hz, leading to an AB system.
The classic appearance of an AB quartet is common for molecules like citrate containing two isolated proton pairs coupled only to each other. Although the citrate molecule is symmetric, the two ¹H protons in each CH2 group are diasterotopic (non-equivalent).
The relative sizes of the 4 peaks and whether they are upright or inverted vary as a function of field strength, pulse sequence, and echo time. These interesting phenomenon occur due to mixing of energy levels between the αβ and βα quantum states and varying associated transition probabilities. Details can be found in the references below, but the practical implication is that care must be taken in selecting imaging parameters to optimize the detection of citrate for MR spectroscopic imaging.
Costello LC, Franklin RB. Concepts of citrate production and secretion by prostate 1. Metabolic relationships. Prostate 1991; 18:25-46.
Jung JA, Coakley FV, Vigneron DB, et al. Prostate depiction at endorectal MR spectroscopic imaging: investigation of a standardized evaluation system. Radiology 2004; 233:701–708.
Mulkern RV, Bowers JL. Calculating spectral modulations of AB systems during PRESS acquisitions. Magn Reson Med 1993; 30:518-9.
Mycielska ME, Patel A, Rizaner N, et al. Citrate transport and metabolism in mammalian cells. Prostate epithelial cells and prostate cancer. BioEssays 2009; 31:10-20.
Scheenen TWJ, Gambarota G, Weiland E, et al. Optimal timing for in vivo ¹H-MR spectroscopic imaging of the human prostate at 3T. Magn Reson Med 2005; 53:1268-1274.
Sharma S. Imaging and intervention in prostate cancer: current perspectives and future trends. Indian J Radiol Imaging 2014; 24:139-148.
How do you perform prostate MRS? Are endorectal coils required?


