A wide range of statistical methods are available to analyze fMRI data. Some are more appropriate for task-based fMRI while others are more applicable to resting-state studies. The most commonly used ones are briefly described below.
Correlation Analysis
The degree of temporal synchrony between two time series X = x1, x2, x3, … and Y = y1, y2, y3, … can be expressed by the correlation coefficient (r) calculated as
|
where r = 0 implies no correlation, r = 1 perfect correlation, and = −1 perfect anti-correlation.
Correlation methodology was one of the earliest techniques applied to task-based fMRI studies in the 1990s. In this setting Y was the time course of the fMRI signal from a single voxel while X was the expected hemodynamic response to a task or stimulus. Voxels with larger r-values had signals more highly correlated to the input and hence were considered relatively activated. |
Today correlation analysis is more commonly used for resting-state fMRI (RS-fMRI), where X and Y are the MRI signals from two different voxels or brain regions. Here higher r-values reflect greater connectivity between pairs of areas and assist in neural network modeling.
General Linear Model (GLM)
The General Linear Model (GLM) is an extension of simple correlation and regression that has evolved into the workhorse technique for analysis of task/stimulus-based fMRI experiments over the last 25 years. GLM is the default method provided by all MR vendors in their clinical fMRI packages and is also widely available in third party software. Often expressed in matrix algebra form, the GLM can be written
Y = β0 + β1X1 + β2X2 + … + ε
This equation states that the fMRI signal (Y) for a given voxel can be expressed as the sum of one or more experimental design variables (X1, X2, …), each multiplied by a weighting factor (β1, β2, …), plus a random error term (ε). There is usually one Xi for each type of stimulus or event presented to the subject. Most models also contain additional Xi "nuisance regressors" to account for motion or signal drift.
 Statistical Parametic Map (SPM)
overlaid on anatomic image
Once the design variables (Xi) and recorded signals (Y) have been loaded into the GLM, a least squares optimization procedure calculates values for the weighting factors (β1, β2, …) corresponding to each design variable. Because the data fit will not be perfect, small errors (εi), also called residuals, will be generated for each time point. Various statistical tools (such as t- and F-tests) can then be applied to explore other features of the data, such as the degree of correlation between variables, assessment of linearity, and comparisons between populations. The final output is usually a Statistical Parametric Map (SPM) overlaid on an anatomic image or template.
Independent Component Analysis (ICA)
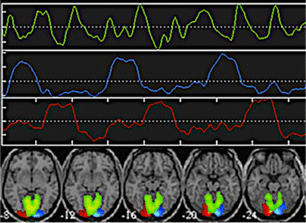
 Spatial ICA separates signals from visual cortex into three components.
The goal of Independent Component Analysis (ICA) is to detect underlying patterns present in the fMRI signal without prior knowledge of the experimental task or shape of the hemodynamic response function. ICA is thus considered a “model free” method for blind source signal separation, allowing identification of unknown independent signals that have been linearly mixed together. For example, ICA methods could be used extract individual voices, music, and noise elements from an audio mixture recorded at a cocktail party without prior knowledge of their sources or locations.
As applied to fMRI data, ICA may distinguish meaningful areas of correlated brain activation from random and semi-periodic physiological noise. Although ICA can be used in conjunction with GLM methods for task-based experiments, it has found its most widespread application for the analysis of resting-state fMRI data.
Multi-Voxel Pattern Analysis (MVPA) and Networks
 From Haxby et al (2001)
Multi-Voxel (Multi-Variate) Pattern Analysis (MVPA) seeks to discover spatial patterns of fMRI activity corresponding to different experimental conditions. Such knowledge might allow us to decode mental states, such as what a person is thinking or feeling, merely by observing fMRI data.
Unlike ICA, MVPA is model-based, and a wide range of MPVA techniques are available depending on the needs of a particular experiment and the psychologic-physiologic questions to be answered. One aspect to be considered is the spatial scope of the analysis. The searchlight approach creates thousands of localized multivariate predictive models; while the whole-brain approach develops a single predictive model across applied diffusely.
Unlike ICA, MVPA is model-based, and a wide range of MPVA techniques are available depending on the needs of a particular experiment and the psychologic-physiologic questions to be answered. One aspect to be considered is the spatial scope of the analysis. The searchlight approach creates thousands of localized multivariate predictive models; while the whole-brain approach develops a single predictive model across applied diffusely.
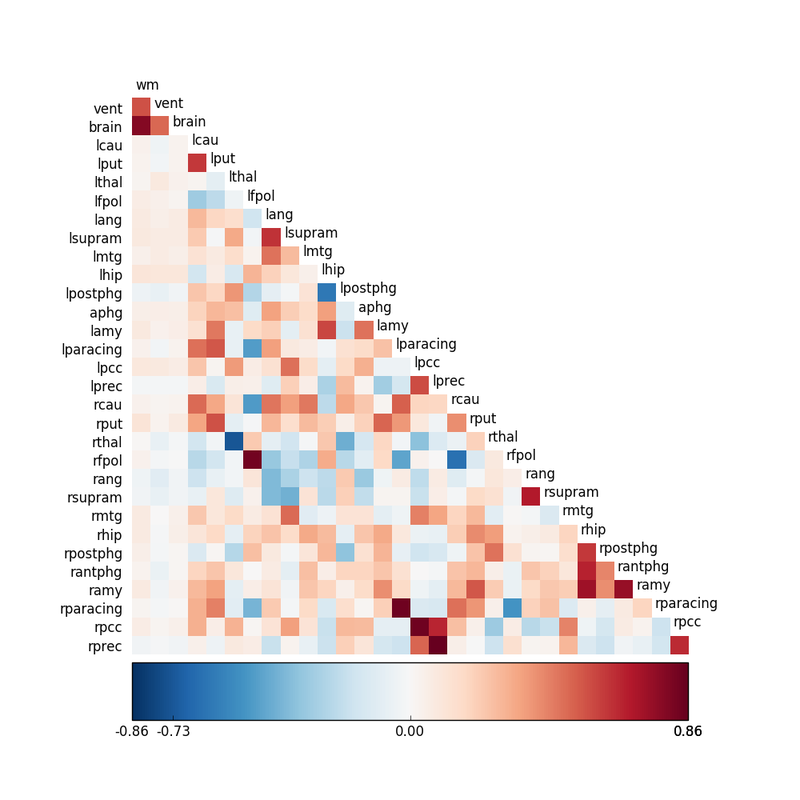
 Brain network graph
Because of the brain's extraordinary complexity, an important role for machine learning has emerged -- the use of computer algorithms to discern complex patterns from empirical data for making models and decisions. This, in turn, has led to multiple methods of for expressing connectivity -- through graphs, network maps, and quantitative measures. The NIH-sponsored Human Connectome Project is an example of the importance of developing a public fMRI data base and processing algorithms for better understanding of brain connectivity.
Advanced Discussion (show/hide)»
No supplementary material yet. Check back soon!
References
Haxby JV, Gobbini MI, Furey ML, et al. Distributed and overlapping representations of faces and objects in the ventral temporal cortex. Science 2001; 293:2425-30. (frequently credited as the first MVPA paper).
Mahmoudi A, Takerkart S, Regragui F, et al. Multivoxel pattern analysis for fMRI data: a review. Comput Math Methods Med 2012: article ID 961257:1-14.
McKeown MJ, Makeig S, Brown GG, et al. Analysis of fMRI data by blind separation into independent spatial components. Hum Brain Mapping 1998; 6:160-188. (First description of ICA applied to fMRI).
Monti MM. Statistical analysis of fMRI time-series: a critical review of the GLM approach. Front Hum Neurosci 2011; 5(28):1-13, doi: 10.3389/fnhum.2011.00028
Poline J-B, Brett M. The general linear model and fMRI: Does love last forever? Neuroimage 2012; 62:871-880.
Powell V, Lehe L. Principal component analysis explained visually. Downloaded from https://setosa.io/ev/principal-component-analysis/ 15 Jan 2022. (Excellent educational article explaining PCA/ICA in graphical terms)
Sporns O, Tononi G, Kötter R. The Human Connectome: a structural description of the human brain. PLoS Comput Biol 2005; 1: 245-251.
Whitlow CT, Casanova R, Maldjian JA. Effect of resting-state functional MR imaging duration on stability of graph theory metrics of brain network connectivity. Radiology 2011; 259:516-524.


