|
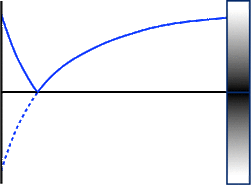
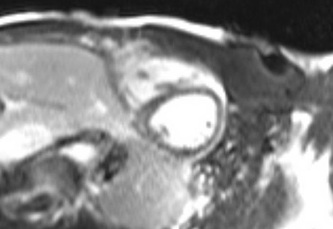
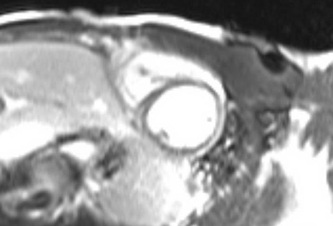
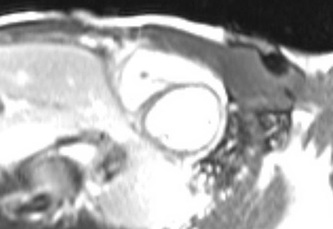
The standard image display method for IR uses magnitude reconstruction. Here the actual direction of Mz (i.e., whether it is points in the +z or −z direction) is irrelevant. The rendered pixel intensity depends only on the magnitude of Mz, not its polarity. Under magnitude reconstruction, air (and any tissue whose magnetization lies is at the zero crossing point at time TI) appears black. This is sometimes illustrated as a "bounce point" diagram, shown right.
|
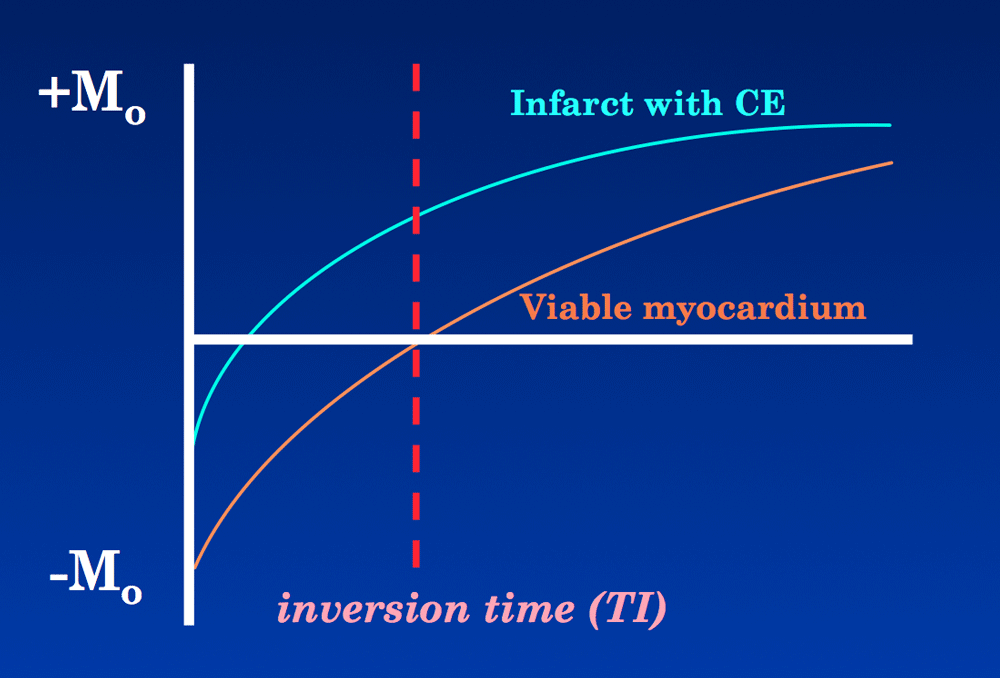
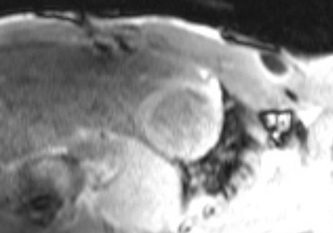
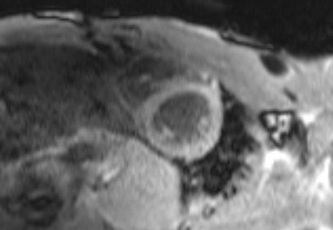
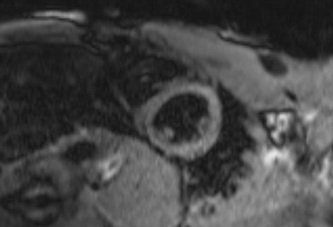
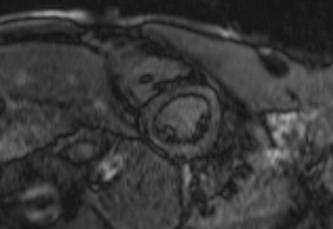
As a brief review, the IR pulse sequence begins with a 180º-inversion pulse that flips the net magnetization (M) of all tissues into the −z direction. Longitudinal recovery along the +z-axis then occurs, with short T1 tissues recovering faster than long T1 tissues. After a few hundred milliseconds at the inversion time (TI), an MR signal is generated. The strength of this signal for each tissue depends on its longitudinal magnetization (Mz) at time TI.
|
Advanced Discussion (show/hide)»
A variety of TI scout pulse sequences are available besides the simple GRE sequence described above. Some centers use an IR-prepared steady-state free precession method while others use a modified Look-Locker technique. It should be noted that the optimal TI determined by these methods may vary considerably.Three-dimensional IR GRE methods are also available, providing superior signal-to-noise and spatial resolution. However, imaging time takes several minutes and the initial TI chosen for myocardial nulling initially may not remain optimal during the entire acquisition. Additionally, 3D techniques are more sensitive to respiratory/motion artifacts than 2D methods.
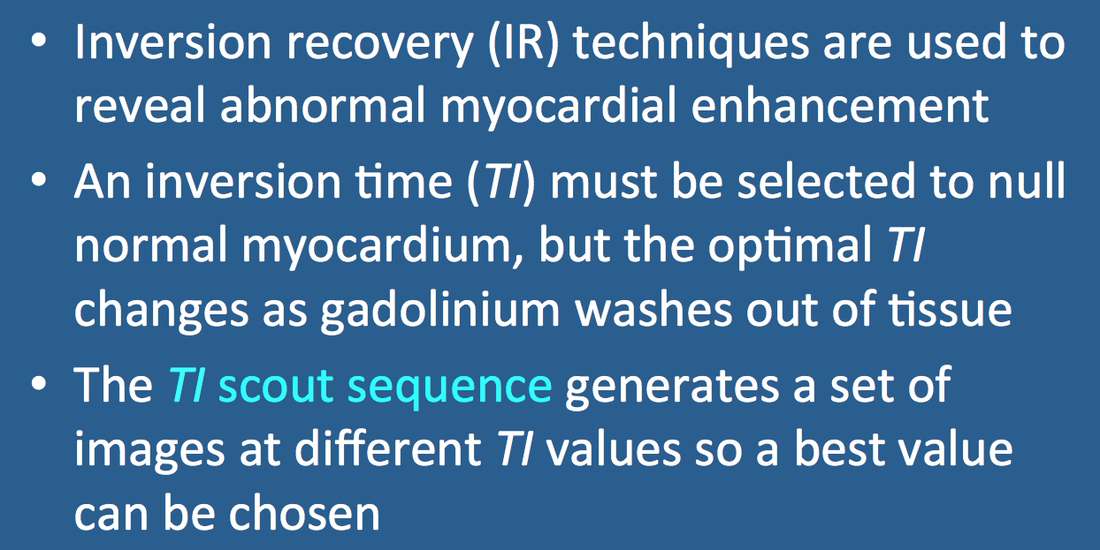
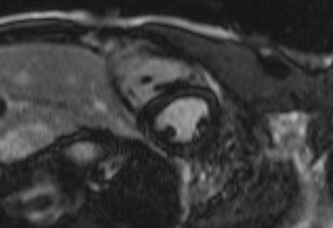
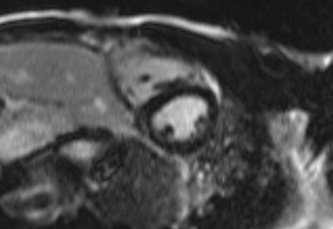
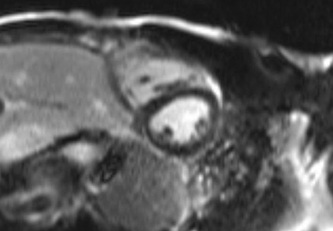
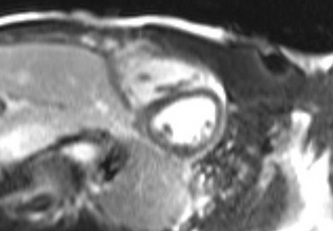
Late contrast enhancement studies are commonly performed between 8 and 20 minutes after gadolinium injection. An expected washout of tissue gadolinium is expected over this time frame, and myocardial T1 values progressively lengthen. This means the optimum TI value that nulls myocardium will need increase over time. For example the calculated TI to null myocardium might be 280 ms at 5 minutes post injection, but could be 380 ms or higher at 20 minutes post injection.
Coelho-Filho OR, Rickers C, Kwong RY, Jerosch-Herold M. MR myocardial perfusion imaging. Radiology 2013; 266:701-715.
Jerosch-Herold M. Quantification of myocardial perfusion by cardiovascular magnetic resonance. J Cardiovasc Mag Reson 2010; 12:57
Kellman P, Arai AE. Imaging sequences for first past perfusion — a review. J Cardiovasc Mag Reson 2007;9:525-537.
Kim RJ, Shah DJ, Judd RM. How we perform delayed enhancement imaging. J Cardiovasc Magn Reson 2003; 5:505-514.
Shehata ML, Basha TA, Hayeri MR, et al. MR myocardial perfusion imaging: insights on techniques, analysis, interpretation, and findings. Radiographics 2014; 34:1636-1657.
Schwitter J. Myocardial perfusion. J Magn Reson Imaging 2006; 24:953-963.
What is the difference between magnitude and phase-sensitive IR for detecting myocardial enhancement?
How is cardiac T1 mapping performed? When is it useful?
