|
Diffusion tensor imaging (DTI) comprises a group of techniques where calculated eigenvalues (λ1, λ2, and λ3) and eigenvectors (ε1, ε2, and ε3) are used to create images reflecting various diffusion properties of a tissue. "Regular" diffusion-weighted (DW) imaging produces images based on only the sum or average of the eigenvalues. The sum of the eigenvalues (λ1+λ2+λ3) is called the trace, while their average (= trace/3) is called the mean diffusivity or apparent diffusion coefficient (ADC).
|
|
Principal Diffusion Direction Map
This is a map that assigns colors to voxels based on a combination of anisotropy and direction. It is also called the colored fractional anisotropy map, fiber direction map or diffusion texture map. The color assignment is arbitrary, but the typical convention is to have the orientation of the principal eigenvector (ε1) control hue and fractional anisotropy (FA) control brightness. Specifically, if ε1 makes angles α, β, and γ with respect to the to the laboratory x-, y-, and z-axes, the color scheme might be apportioned in the ratios: Red = FA • cos α
Green = FA • cos β Blue = FA • cos γ |
|
Fiber Tracking Map
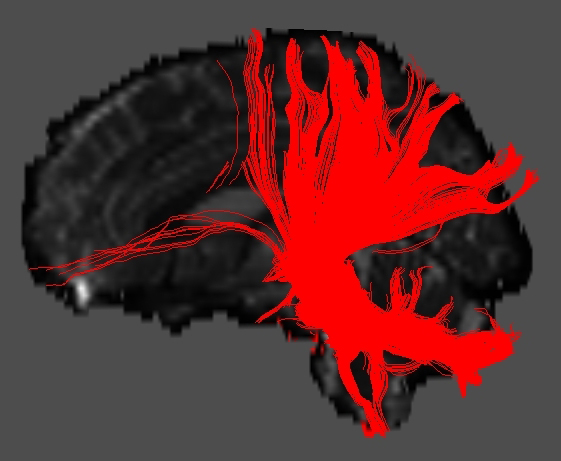
Axonal tracts are commonly mapped using a deterministic method known as FACT (fiber assignment by continuous tracking). In this method the user selects "seed voxels" in a certain area of the brain and automated software computes fiber trajectories in and out of that area. This is accomplished by following the primary eigenvector (ε1) in each voxel until it encounters a neighboring voxel, at which time the trajectory is changed to point in the direction of the new eigenvector.
|
Advanced Discussion (show/hide)»
Although DTI and fiber tracking methods are proving valuable in the research realm for groups of subjects, I would caution their application for clinical diagnosis in individual patients. First, considerable variation of regional FA values exists among subjects as a function of age, sex, location, and MR technique. To reduce errors due to crossing, kissing, or branching fibers, a minimum of 20 diffusion directions should be obtained (with 64 or more preferred). If FA values are compared to normal data bases, it is critical that multiple comparison (e.g. Bonferroni) corrections be performed to avoid spurious conclusions of statistical significance when none exist.
Tractography results are even more variable than regional FA measurements and are highly dependent on the exact location of the initial seed points and tracking algorithms employed. An arbitrary starting point must be selected, whose exact location, size and orientation significantly affects results. Tractography algorithms differ in detail between vendors and arbitrary decisions must be made as to when tracking should stop. Termination criteria may be based on FA value (terminate tracking when FA falls below a certain value, e.g., 0.25), turning angle (terminate tracking when angle between adjacent voxels exceeds a certain value, e.g. 40°), or minimum fiber length (do not display fibers shorter than a certain length, e.g. 2 cm). Anyone who plays around with setting seed locations and termination parameters can easily manipulate visual displays of fiber tracts.
Figley CR, Uddin MN, Wong K, et al. Potential pitfalls of using fractional anisotropy, axial diffusivity, and radial diffusivity as biomarkers of cerebral white matter microstructure. Front Neurosci 2022;15:799576. [DOI LINK]
Minati L, Weglarz WP. Physical foundations, models, and methods of diffusion magnetic resonance imaging of the brain: a review. Concepts Magn Reson 2007; 30A:278-307.
Mukherjee P, Berman JI, Chung SW, et al. Diffusion tensor MR imaging and fiber tractography: theoretic underpinnings. AJNR Am J Neuroradiol 2008; 29:632-640.
Mukherjee P, Chung SW, Berman JI, et al. Diffusion tensor MR imaging and fiber tractography: technical considerations. AJNR Am J Neuroradiol 2008; 29:843-52.
Tournier J-D, Mori S, Leemans A. Diffusion tensor imaging and beyond. Magn Reson Med 2011; 65:1532-1556.
Wu W, Miller KL. Image formation in diffusion MRI: a review of recent technical developments. J Magn Reson Imaging 2017; 46:646-662.


