At most clinical cardiac MR centers today, only qualitative (visual) assessment of myocardial perfusion is commonly performed. Perfusion defects (hypoenhancement) for each cardiac segment are typically graded into one of five categories based on transmural extent: no defect, defect <25%, 25−50%, 50−75%, or defect >75%. Regional areas of hypoenhancement exceeding 25% in any segment are generally considered to be pathological (inducible perfusion deficits).
Quantification of myocardial perfusion is indeed possible, but is technically demanding, subject to errors, and requires considerable post-processing time. As such, it is largely confined to research centers and has not yet attained "mainstream" status for routine clinical care. To be done properly, quantification of myocardial perfusion requires the following constraints and assumptions:
- Signal intensity should be proportional to gadolinium concentration. In reality, some departure from direct proportionality is expected. The degree of non-linearity is dependent on the absolute concentration of gadolinium, field strength, pulse sequence, type of magnetization preparation, inversion time, and k-space ordering. A half-dose (0.05 mmol/kg) or less of gadolinium contrast should be used to avoid T2*-shortening and underestimation of myocardial blood flow.
- Corrections for surface-coil and RF-nonuniformities. Intensity correction maps are often obtained prior to injection (or may be incorporated into the parallel imaging algorithm itself). B1-field nonuniformity of excitation results in spatially-dependent flip angles. The use of adiabatic (BIR-4), notched, or composite RF-pulses may be needed, especially at 3T and higher.
- Modeling of myocardial structure. The simplest analysis considers the myocardium a single compartment that accumulates gadolinium based on inflow and outflow rates in accordance with Zierler's Central Volume Principle (a generalization of Fick's Principle). More commonly, a two-compartment model is used, dividing the myocardium into vascular and interstitial spaces. More complex models have been developed, including those considering (a) fast water exchange with a third (intracellular) compartment, and (b) spatially-dependent variations of gadolinium concentration across the myocardium.
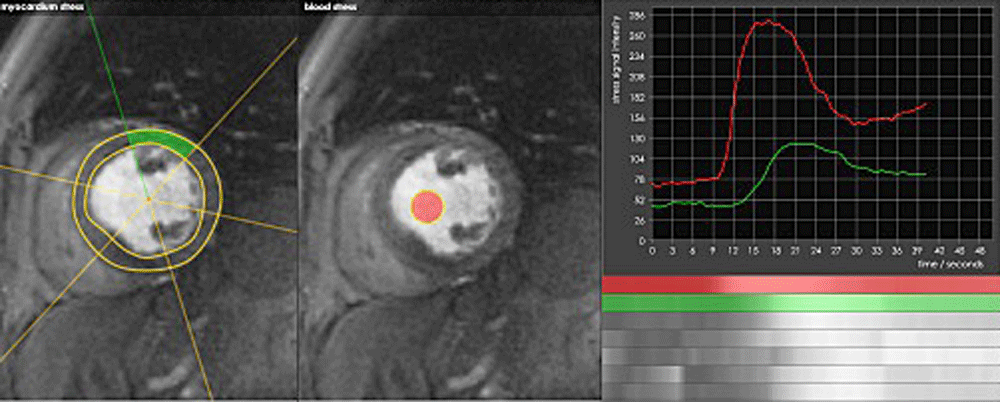
- Mathematical analysis. All mathematical analyses for perfusion require measurement of the arterial input function (AIF), representing the changing signal intensity of blood in the LV or aorta during the first pass of gadolinium (red curve below). An assumption about the impulse response of the myocardium to the AIF must then be made (a popular choice is to describe it as a Fermi function). Finally, a mathematical procedure known as deconvolution must be applied to estimate parameters of the model chosen, including myocardial perfusion in absolute terms (ml/min/g of tissue).

Commercially available software (such as this example from CMRtools.com) allows model-based quantification of myocardial perfusion. Here the ventricular blood pool (red) serves as the arterial input function (AIF).
|
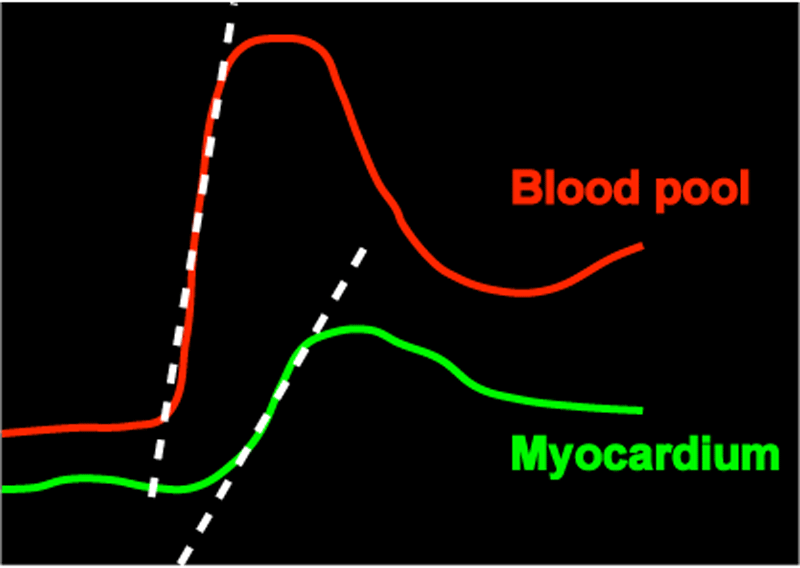
A quicker, semi-quantitative method for myocardial perfusion commonly employed is to measure the "up-slope" of signal in the myocardium during the first pass of gadolinium (dotted lines above). To account for variations in arterial bolus, a normalized myocardial perfusion slope may be obtained by dividing the myocardial uptake slope by the blood pool uptake slope. Other semi-quantitative indices are also possible (e.g., time-to-peak, mean transit time, ratio of stress-to-rest perfusion up-slopes).
Advanced Discussion (show/hide)»
Accurate measurement of the arterial input function (AIF) is a major source of error limiting the accuracy of quantitative perfusion methods. The true AIF is affected by T2* effects that occur with high gadolinium concentrations during passage of the contrast bolus. Two imaging strategies have resulted to ameliorate these effects: 1) a "dual bolus" method using AIF measurement during a separate tiny test dose (5-10% of the total dose); and 2) a "dual sequence" method where one of the imaging slices is replaced by an AIF measurement slice employing an acquisition that avoids T2* and saturation effects of high gadolinium concentrations. These techniques are discussed in greater detail in the references.
References
Axel L. Tissue mean transit time from dynamic computed tomography by a simple deconvolution technique. Invest Radiol 1983; 18:94-99.
Christian TF, Aletras AH, Arai AE. Estimation of absolute myocardial blood flow during first-pass MR perfusion imaging using a dual-bolus injection technique: comparison to single-bolus injection method. J Magn Reson Imaging 2008; 27:1271-1277. (slightly more accurate quantitative results with double-bolus method).
Fick A. Ueber die Messung des Blutquantums in der Herzventrikeln. Sitz der Physik-Med Ges Wurzburg 1870; 2:16–28.
Gatehouse PD, Elkington AG, Ablitt NA, et al. Accurate assessment of the arterial input function during high-dose myocardial perfusion cardiovascular magnetic resonance. J Magn Reson Imaging 2004; 20:39-45.
Jerosch-Herold M. Quantification of myocardial perfusion by cardiovascular magnetic resonance. J Cardiovasc Magn Reson 2010; 12:57.
Nagel E, Klein C, Paetsch I, et al. Magnetic resonance perfusion measurements for the noninvasive detection of coronary artery disease. Circulation 2003; 108:432-437 (Description of the up-slope technique for perfusion measurement)
Shehata ML, Basha TA, Hayeri MR, et al. MR myocardial perfusion imaging: insights on techniques, analysis, interpretation, and findings. RadioGraphics 2014; 34:1636-1657.
Zierler K. Indicator dilution methods for measuring blood flow, volume, and other properties of biological systems: a brief history and memoir. Ann Biomed Eng 2000; 28:836-848.
Related Questions
How do you interpret myocardial perfusion studies?
How do you interpret myocardial perfusion studies?

