The human body has no effective mechanism for eliminating excess iron. Patients with thalassemia and transfusion-related anemias may develop systemic iron overload, with deposition of iron species in the heart, liver, spleen, pancreas, and gonads. End-organ damage results from the formation of reactive oxygen species and lipid peroxidation. Clinical monitoring of systemic iron overload is important as chelation therapy may improve prognosis in these patients.
Focal tissue accumulations of superparamagnetic hemosiderin and ferritin create local susceptibility-induced distortions in the magnetic field. These cause the transverse magnetization to decay much faster than would be predicted by natural atomic and molecular mechanisms ("true" T2). This "observed" or "effective" T2 value is denoted T2* ("T2-star"). T2* is thus always less than or equal to T2. The values for T2 and T2* are connected by the relationship
where 1/T2i = γ ΔBi is the relaxation rate contribution attributable to field inhomogeneities (ΔBi) across a voxel. Note that the equation is a sum of relaxation rates (1/T2's) rather than relaxation times (T2's).
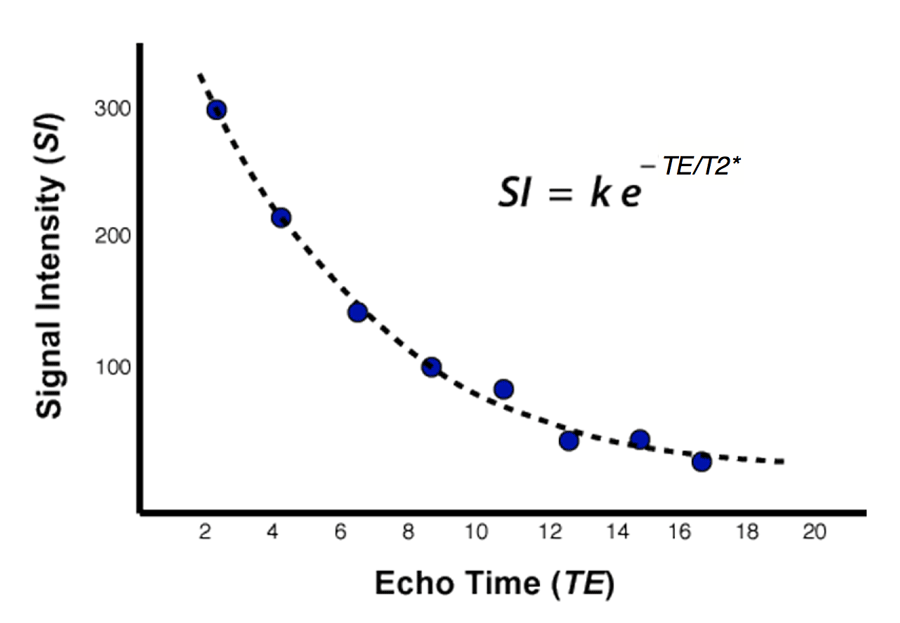
T2*-weighted MRI is a well-validated predictor of both cardiac and hepatic iron content and superior to noninvasive methods such as measurement of serum ferritin. Several methods of estimating T2* values are possible, but the most common technique is to acquire a series of breath-hold gradient-echo (GRE) images at progressively increasing echo times (TE's) as shown below:
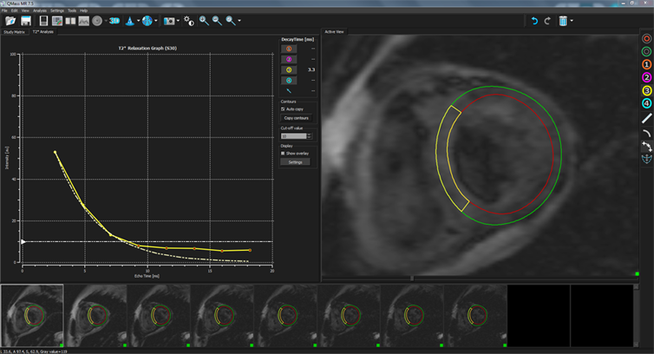
Measurements of signal intensity are made over the ventricular septum (thus avoiding susceptibility artifacts from cardiac veins and air-containing lung). After subtracting background noise, the signal intensity curve is fitted to a simple exponential resulting in an estimate of myocardial T2*. Multi-echo GRE images of the liver are also usually acquired at the same setting, allowing hepatic T2* values to be computed. The degree of iron overload present in the liver or heart is often qualitatively characterized using a scale similar to that below.

Semiautomated T2* mapping is available several independent companies, such as that from Medis above.
|
In addition to third-party providers such as FerriScan and Medis, several MR vendors offer T2* calculation software with color overlay mapping as optional packages: GE (Star-Map), Siemens (MapIT), and Hitachi (T2* RelaxMap).
Advanced Discussion (show/hide)»
No supplementary material yet. Check back soon!
References
Anderson LJ, Holden S, Davis B, et al. Cardiovascular T2-star (T2*) magnetic resonance for the early diagnosis of myocardial iron overload. Eur Heart J 2001; 22:2171-2179.
Carpenter J-P, He T, Kirk P, et al. On T2* magnetic resonance and cardiac iron. Circulation 2011; 123:1519-1528.
Labranche R, Gilbert G, Corny M, et al. Liver iron quantification with MR imaging: a primer for radiologists. RadioGraphics 2018; 38:392-412. (Focuses on the liver, not the heart, but general principles are the same).
Messroghli DR, Moon JC, Ferreira VM, et al. Clinical recommendations for cardiovascular magnetic resonance mapping of T1, T2, T2* and extracellular volume: a consensus statement by the Society for Cardiovascular Magnetic Resonance (SCMR) endorsed by the European Association for Cardiovascular Imaging (EACVI). J Cardiovasc Magn Reson. 2017;19:75.
Triadyaksa P, Oudkerk M, Sijens PE. Cardiac T2* mapping: techniques and clinical applications. J Magn Reson Imaging 2020; doi:10.1002/jmri.27023
Westwood MA. How I do Thalassaemia. From SCMR "How I Do" Series, downloaded from this link, April, 2015.
Wood JC. Magnetic resonance imaging measurement of iron overload. Curr Opin Hematol 2007; 14:183-190.
Related Questions
What is the difference between T2 and T2*?
What is ferritin? How is it different from hemosiderin?
How do you produce multiple GRE's from a single pulse?
How is cardiac T1 mapping performed? When is it useful?
What is the difference between T2 and T2*?
What is ferritin? How is it different from hemosiderin?
How do you produce multiple GRE's from a single pulse?
How is cardiac T1 mapping performed? When is it useful?


