|
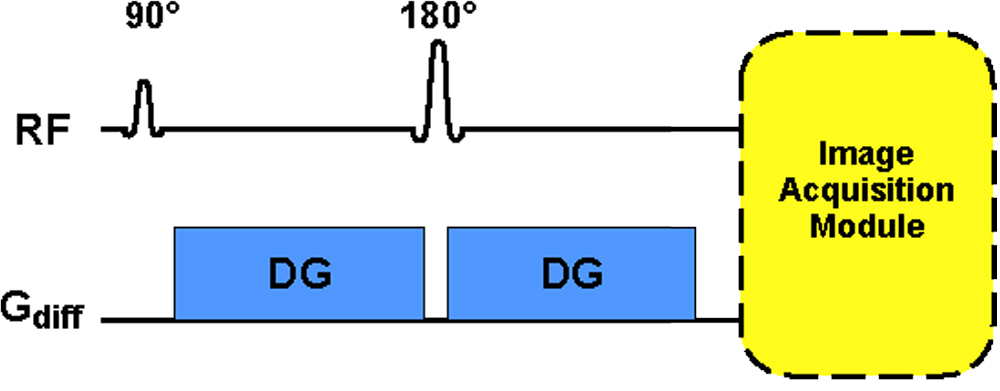
Diffusion-weighted imaging (DWI) sequences are based around a 90°-180° architecture to which a pair of pulsed diffusion gradients (DG's) have been added. Image acquisition takes place near the time of the spin echo, which is typically at TE = 60-120 msec. The signal intensity (SDWI) for such a sequence can be written as
|
where k is a scaling constant, TR, TE, and b are operator-selected parameters, [H] is spin density, and ADC is the apparent diffusion coefficient. The TR value used for most DWI sequences is extremely long (8-10 sec), so the (1−e−TR/T1) term may be disregarded.
This equation explicitly demonstrates that the signal intensity of a Trace-DW image is directly related to T2 and inversely related to ADC. Lesions that restrict diffusion (strokes, abscesses, etc.) lower the ADC and appear bright. Conversely, substances with unrestricted diffusion and high ADC's (like cerebrospinal fluid) appear dark.
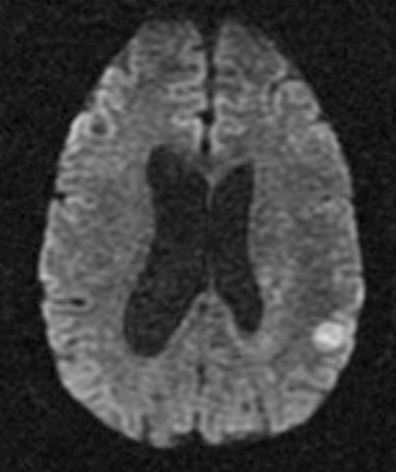
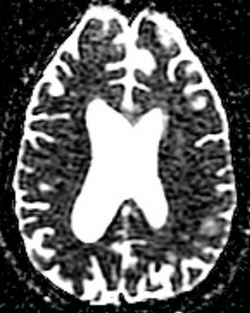
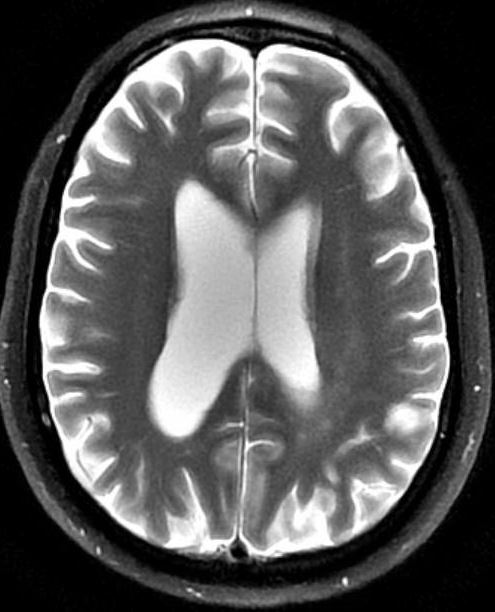
The take-home point is that Trace DW images are both diffusion- and T2-weighted. Lesions that have very long T2-values may appear bright even though they do not restrict diffusion. This phenomenon, illustrated below, is known as "T2 shine-through". Whenever a bright lesion is encountered on a Trace DW image, the ADC map should be inspected to look for a corresponding area of low signal (restricted diffusion). Such lesions will also appear very bright on conventional T2-weighted images serving as a further confirmatory finding.
The take-home point is that Trace DW images are both diffusion- and T2-weighted. Lesions that have very long T2-values may appear bright even though they do not restrict diffusion. This phenomenon, illustrated below, is known as "T2 shine-through". Whenever a bright lesion is encountered on a Trace DW image, the ADC map should be inspected to look for a corresponding area of low signal (restricted diffusion). Such lesions will also appear very bright on conventional T2-weighted images serving as a further confirmatory finding.
|
Rounded left parietal lesion (a glioma) shows moderate brightness on Trace DW image. This is not due to restricted diffusion, however, as the lesion is also bright on the ADC map (implying increased diffusivity). The T2-weighted SE image confirms the brightness on the Trace image is a T2 "shine-through" effect.
|
Advanced Discussion (show/hide)»
No supplementary material yet. Check back soon!
References
Burdette J, Elster AD, Ricci PR. Acute cerebral infarction: quantification of spin-density and T2 shine-through phenomena on diffusion-weighted MR images. Radiology 1999; 212:333-339.
Schaefer PW, Grant PE, Gonzalez RG. Diffusion-weighted MR imaging of the brain. Radiology 2000; 217:331-345.
Silvera S, Oppenheim C, Touzé E, et al. Spontaneous intracerebral hematoma on diffusion-weighted images: influence of T2-shine-through and T2-blackout effects. AJNR Am J Neuroradiol 2005; 26:236-242.
Related Questions
How do you make a DW image?
What is the Trace DW image? How does it differ from the ADC map?
How do you make a DW image?
What is the Trace DW image? How does it differ from the ADC map?


