Advanced Discussion (show/hide)»
The following is a brief derivation of the equation relating gadolinium concentration [Gd] and signal intensities given in the text above.
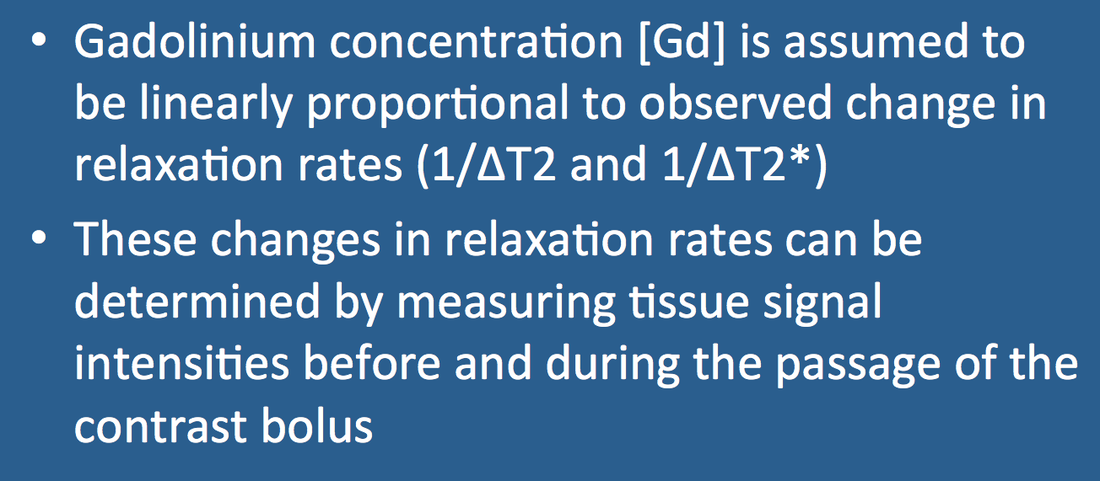
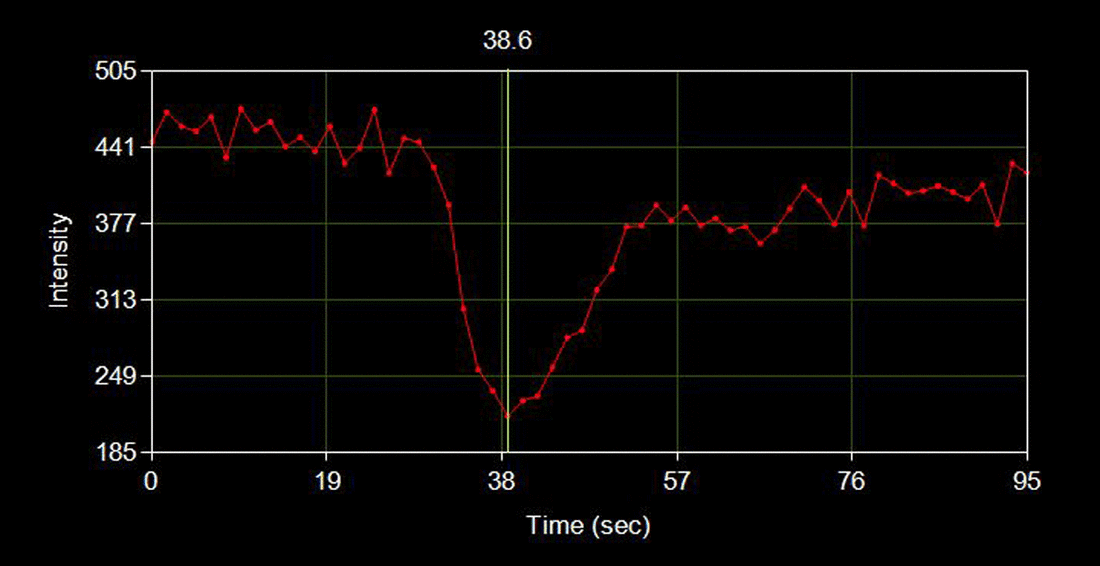
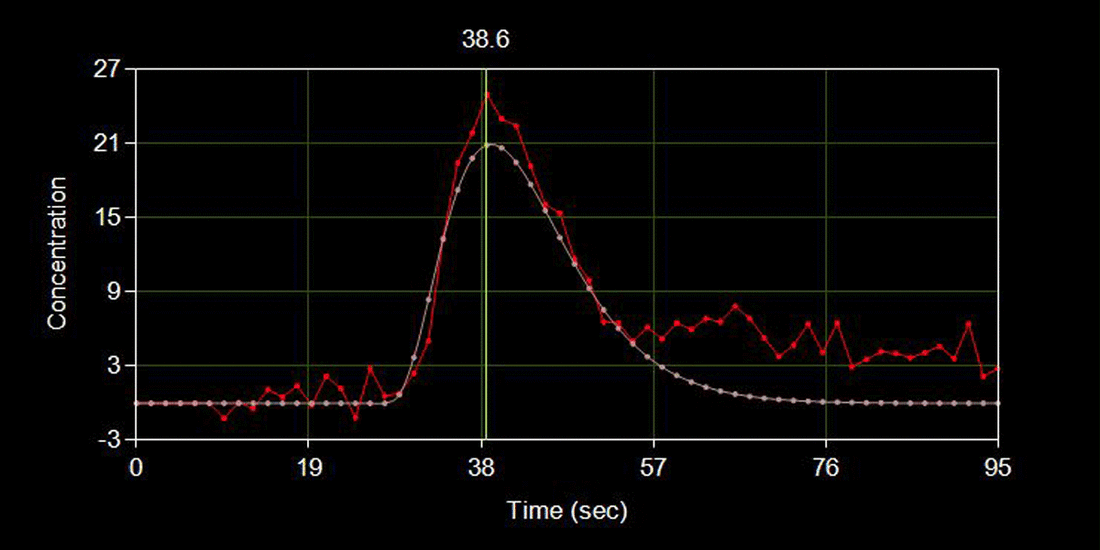
In simple solutions of contrast agents at physiologic concentrations, changes in observed relaxation rates (ΔR2=1/ΔT2 and ΔR2*=1/ΔT2*) are linearly related to gadolinium concentration [Gd]. Thus by measuring the change in relaxation rates within a voxel during passage of a contrast bolus, the approximate Gd concentration at that time and location can be determined.
Recall that the signal (S) generated by a simple gradient echo sequence of the type typically used in a DSC experiment decays exponentially with time given by the expression
S = k e−TE/T2* = k e−TE•R2*
where k is a constant that includes a conglomeration of tissue-related (e.g., T1, ρ, χ) and technical (e.g., Bo, TR, NEX, α) factors.
This equation can be solved for R2* by taking logarithms of both sides and rearranging terms.
ln(S/k) = − TE • R2*
R2* = − (1/TE) • ln(S/k)
Before the gadolinium bolus arrives we assume the tissue voxel has an initial relaxation rate R2*o and signal So. At time = t during passage of the bolus, we assume the relaxation rate increases to R2*t and the signal falls to St. In other words
R2*o = − (1/TE) • ln(So /k)
R2*t = − (1/TE) • ln(St /k)
The change in R2*, which is proportional to gadolinium concentration, can be written
ΔR2* = R2*t − R2*o = − (1/TE) • [ ln(St /k) – ln(So /k) ]
Using the logarithmic identity ln(A) − ln(B) = ln(A/B) we can rewrite this last equation as
ΔR2* = − (1/TE) • ln(St /So)
The major assumption that changes in relaxation rates are proportional to gadolinium concentration may be justifiably challenged. Specifically, such a linear relaxivity relationship holds true only for dilute homogenous aqueous solutions of gadolinium using spin-echo pulse sequences.
Kiselev VG. On the theoretical basis of perfusion measurements by dynamic susceptibility contrast MRI. Magn Reson Med 2001; 46:1113-1122.
Østergaard L, Johannsen P, Host-Poulsen P, et al. Cerebral blood flow measurements by magnetic resonance imaging bolus tracking: comparison with [15O]H2O positron emission tomography in humans. J Cerbral Blood Flow Metab 1998; 18:935-940. (Early paper showing good agreement between DSC and PET measurements of cerebral blood flow. However, the MR data had to be "calibrated" to absolute flow rates measured by PET, meaning that absolute quantification of CBF by DSC alone was not possible).
Simonsen CZ, Østergaard L, Smith DF, et al. Comparison of gradient- and spin-echo imaging: CBF, CBV, and MTT measurements. J Magn Reson Imaging 2000; 12:411-416. (spin-echo techniques may be more accurate than GRE for quantification of microvascular flow)
What is meant by the relaxivity of a contrast agent? How is it measured?
If gadolinium contrast is used to increase signal intensity on routine MR images, why does it decrease signal on DSC perfusion images?


