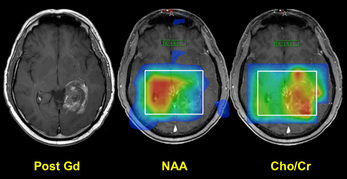
 Metabolite maps of a malignant glioma. Note lack of NAA and increased choline/creatine ratio in the lesion.
Metabolite maps are gray-scale or color-coded displays of spectral peak areas obtained from 2D- or 3D-CSI data overlaid on corresponding anatomic images. Although providing an intuitive distribution of metabolites within a lesion, they can be somewhat misleading and care must be taken in their interpretation.
Standard algorithms provided by various MR vendors are often quite rudimentary, based on simple peak integration supplemented by minor baseline correction and fitting. There is often no correction for frequency-shifts differences of the metabolites. A spatial filter is typically applied to provide a smooth topography and avoid a pixelated appearance.
Standard algorithms provided by various MR vendors are often quite rudimentary, based on simple peak integration supplemented by minor baseline correction and fitting. There is often no correction for frequency-shifts differences of the metabolites. A spatial filter is typically applied to provide a smooth topography and avoid a pixelated appearance.
Accordingly, the raw data from each voxel producing the map should be carefully inspected to exclude artifacts, such as distortions due to local field inhomogeneities from blood products or calcification. Lactate metabolite maps are especially prone to lipid contamination from adjacent scalp fat.
Advanced Discussion (show/hide)»
Most vendor-supplied mapping schemes are very rudimentary and simply assign resonances based on frequency ranges. For example, NAA might be assigned 2.02 ± 0.08 ppm while Cho is defined as all pixels in the 3.24 ± 0.08 ppm range. "Concentrations" may be alternately defined as the sum, average, or peak pixel values for a given metabolite range. A rainbow color scale is commonly used for display, but the values are arbitrarily chosen and should not be used to make strong comparisons about various anatomic regions or to assess changes in metabolite levels between different studies.
References
Crane JC, Olson MP, Nelson SJ. SIVIC: Open-source, standards-based software for DICOM MR spectroscopy workflows. Int J Biomed Imaging 2013, Article ID 169526:1-12.
Maudsley AA, Darkazanli A, Alger JR, et al. Comprehensive processing, display, and analysis for in vivo MR spectroscopic imaging. NMR Biomed 2006; 19:492-503.
