Advanced Discussion (show/hide)»
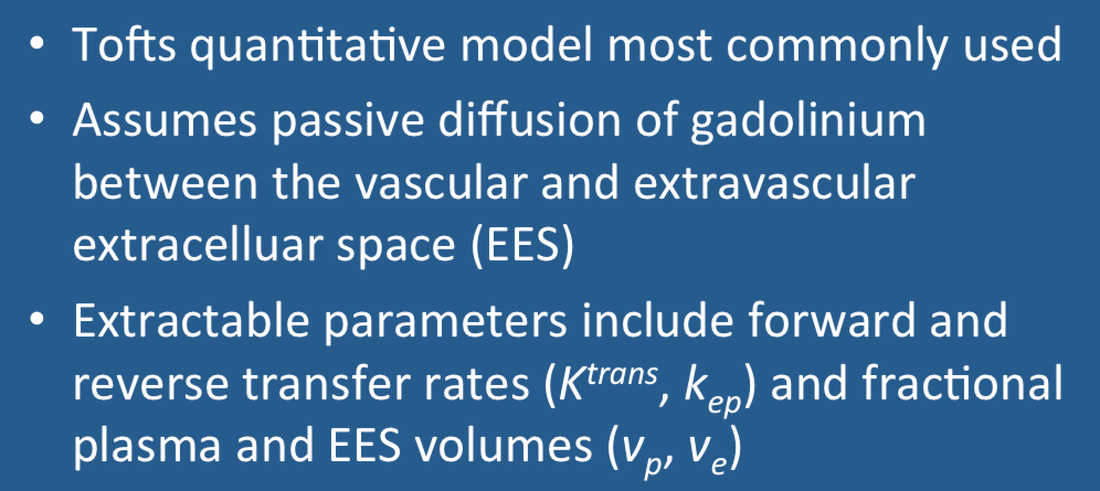
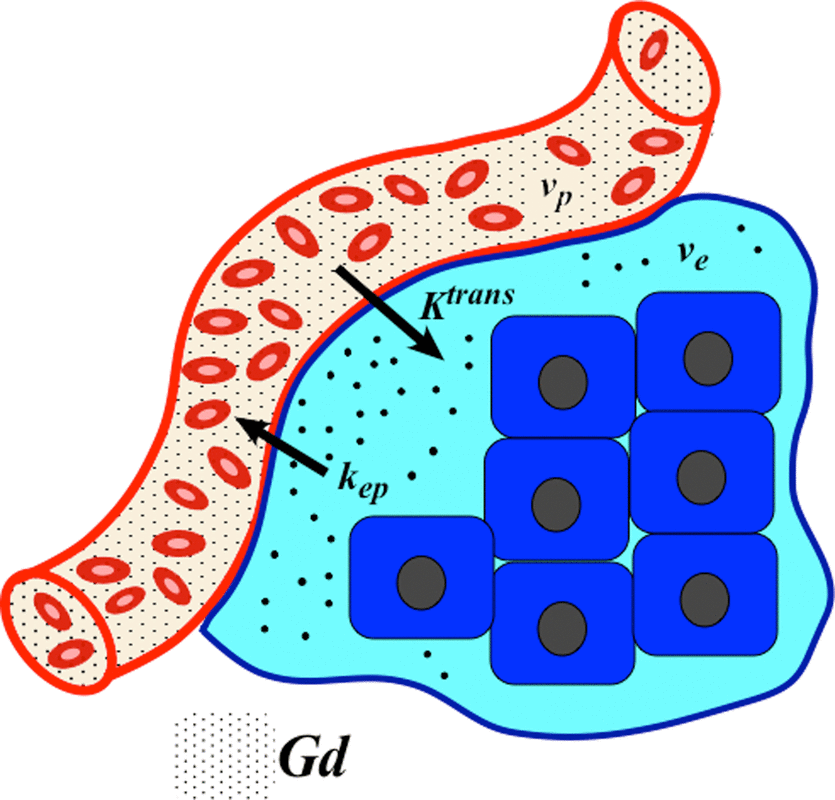
The original Tofts and Kermode (1991) model assumes that the equilibrium concentration of gadolinium in whole tissue, Ct, is driven by simple passive diffusion based on its concentration difference between plasma (Cp) and the tissue extravascular extracellular space (Ce). Since gadolinium contrast does not enter cells, Ce is higher than Ct by the factor (1/ve), where ve is the dimensionless volume fraction (0<ve<1) of the tissue extravascular extracellular space (EES). The defining Tofts-Kermode equation is therefore
where Ktrans is the mass transfer influx constant measured in units of min−1. Note that the right side of the equation can be re-written as
with kep defined as Ktrans/ve, representing the (reverse) transfer rate for contrast from the EES back into plasma. Note that Ktrans, ve, and kep are interrelated and thus not all independent parameters. If two are known, the third can be computed.
In a DCE study we are able to determine the time-dependent gadolinium concentration in plasma, Cp, using either an arterial input function (AIF) or estimating it assuming bi-exponential decay from an initial value resulting from renal clearance and whole body extracellular space distribution. Likewise, by measuring the signal intensities of tissue we can determine the tissue gadolinium concentration, Ct. We do not know either Ktrans or ve, however. These are potentially important physiological parameters of interest that can be estimated by fitting the measured data to the Tofts model.
Using nonlinear least squares estimation on a voxel-by-voxel basis, Ktrans and ve can then be computed.
The above formulation assumes that the intravascular contribution to total tissue gadolinium concentration is negligible and that Ct arises purely from gadolinium in the EES. Although this may be true for lesions such as multiple sclerosis plaques and low-grade tumors, it is certainly not the case for many malignant tumors and other highly vascular lesions.
A common modification of the original Tofts model takes this vascular contribution into account, introducing a new parameter vp, the volume fraction of total tissue containing plasma. Like its counterpart ve, vp is dimensionless as it represents blood plasma volume per unit volume of tissue. This expanded Tofts model now has 2 compartments and 3 parameters, admitting to the following solution including a new term (vpCp)
A pharmacokinetic model was developed by Brix and colleagues in Germany at the same time Tofts and Kermode were working in England. The original Brix formulation, now expanded, was an open-exchange model with central (vascular/plasma) and peripheral (tissue extracellular space) compartments. Forward and reverse gadolinium exchange rates between the compartments were denoted K12 and K21, respectively, corresponding roughly to Ktrans and kep of the Tofts model. However, the Brix model explicitly separated flow from permeability effects (which are confounded in the Ktrans concept). The original Brix model also used a rather inaccurate method of estimating gadolinium concentration from percent signal changes, but had the advantage that it did not require precontrast tissue T1 mapping nor measurement of an arterial input function.
The Patlak model has recently become popular for the analysis of subtle areas of increased blood-brain-barrier permeability (which may be a clue to the pathophysiology of Alzheimer disease). Like the others, the Patlak model describes a highly perfused two-compartment model. The major difference is that contrast diffusion from the blood plasma to the extravascular extracellular space (EES) is considered to be unidirectional. The tracer concentration in tissue Ct(t) is given by
A linear graphical analysis of the ratio Ct(t)/Cp(t) regressed against ∫Cp(τ)dτ/Cp(t) produces a straight line with slope KTrans and y-intercept vp.
Brix G, Semmler W, Port R, et al. Pharmacokinetic parameters in CNS Gd-DTPA enhanced MR imaging. J Comput Assist Tomogr 1991; 15:621-628.
Heye AK, Culling RD, del C Valdés Hernández M, et al. Assessment of blood-brain barrier disruption using dynamic contrast-enhanced MRI. A systematic review. NeuroImage: Clinical 2014; 6:262-274. [DOI LINK]
Manning C, Stringer M, Dickie B, et al. Sources of systematic error in DCE-MRI estimation of low-level blood-brain barrier leakage. Magn Reson Med 2021; (in press) [DOI LINK] (Casts doubt on accuracy of Patlak model for measuring BBB disruption)
Tofts PS. Modeling tracer kinetics in dynamic Gd-DTPA MR imaging. J Magn Reson Imaging 1997; 7:91-101.
Tofts PS, Brix, G, Buckley DL, et al. Estimating kinetic parameters from dynamic contrast-enhanced T1-weighted MRI of a diffusable tracer: standardized quantities and symbols. J Magn Reson Imaging 1999; 10:223-232.
Tofts PS, Kermode AG. Measurement of the blood-brain barrier permeability and leakage space using dynamic MR imaging. 1. Fundamental concepts. Magn Reson Med 1991; 17:357-367
Zaharchuk G. Theoretical basis of hemodynamic MR imaging techniques to measure cerebral blood volume, cerebral blood flow, and permeability. AJNR Am J Neuroradiol 2007; 28:1850-8.
Is Ktrans the same as permeability?
How do calculated DCE parameters relate to patterns of enhancement we see on clinical images?


