Advanced Discussion (show/hide)»
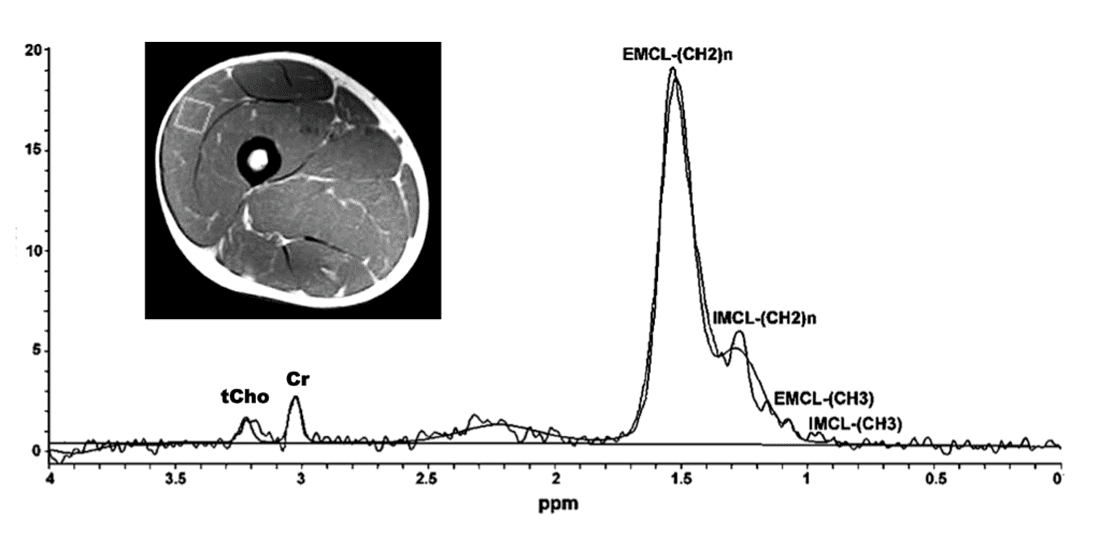
As shown in the spectrum above IMCL and EMCL can be separated based on their slight differences in resonant frequencies. Complicating the matter is the fact that this frequency difference depends on the angle the muscle fibers make with the main magnetic field. IMCL is dispersed in spherical droplets within muscle cell cytosol, while EMCL is distributed in tube- or sheet-like structures between the muscle fibers. The relative levels of EMCL and IMCL are are of interest to obesity researchers. IMCL appears increased in patients with metabolic syndrome, diabetes, pre-diabetes, and increased resistance to insulin.
Using special techniques, a large resonance can be observed arising from the two aromatic histidine protons of the dipeptide carnosine . These peaks occur on the other side of water (at δ = 7.0 and 8.0 ppm), so are not usually detected by routine spectroscopy. The role of carnosine is incompletely understood, but appears to be involved with buffering of hydrogen ions and is correlated with the number of type II muscle fibers present. The splitting of carnosine peaks by residual dipolar coupling is pH dependent and can be used to estimate tissue pH.
Another spectral peak in muscle requiring special techniques to detect arises from deoxy-myohemoglobin. Because of the paramagnetic iron center, the chemical shift of its histidyl proton occurs at the very distant chemical shift of approximately +78 ppm. Changes in this peak have been used to study the availability and use oxygen in skeletal muscle. Lactate (at δ = 1.33 ppm) can also be used for this purpose, but is obscured by overlying lipid signals. However, the lactate signal can be separated from fat by spectral editing techniques, described in a later Q&A.
After heavy exercise, a peak at 2.13 ppm can be detected that has been ascribed to the acetyl group of acetylcarnitine. Carnitine and its metabolites are important in the transport of fatty acids into mitochondria for β-oxidation. The level of acetylcarnitine on ¹H-MRS of muscle may serve as an index for the availability of acetyl-CoA for entry into the citric acid cycle.
Boesch C, Slotboom J, Hoppeler H, Kreis R. In vivo determination of intra-myocellular lipids in human muscle by means of localized ¹H-MR-spectroscopy. Magn Reson Med 1997; 37:484-493.
Deshmukh S, Subhawong T, Carrino JA, Fayad L. Role of MR spectroscopy in musculoskeletal imaging. Indian J Radiol Imaging 2014; 24:210-216.
Fayad LM, Jacobs MA, Wang X, et al. Musculoskeletal tumors: How to use anatomic, functional, and
metabolic MR techniques. Radiology 2012; 265:340‑56.
Shick F, Eismann B, Jung W-I, et al. Comparison of localized proton NMR signals of skeletal muscle and fat tissue in vivo: two lipid compartments in muscle tissue. Magn Reson Med 1993; 29:158-167.
Zhu R, Wen C, Li J, et al. Lipid storage changes in human skeletal muscle during detraining. Front Physiol 2015; 6:309.
What peaks are seen in the ³¹P spectrum and what do they mean?
