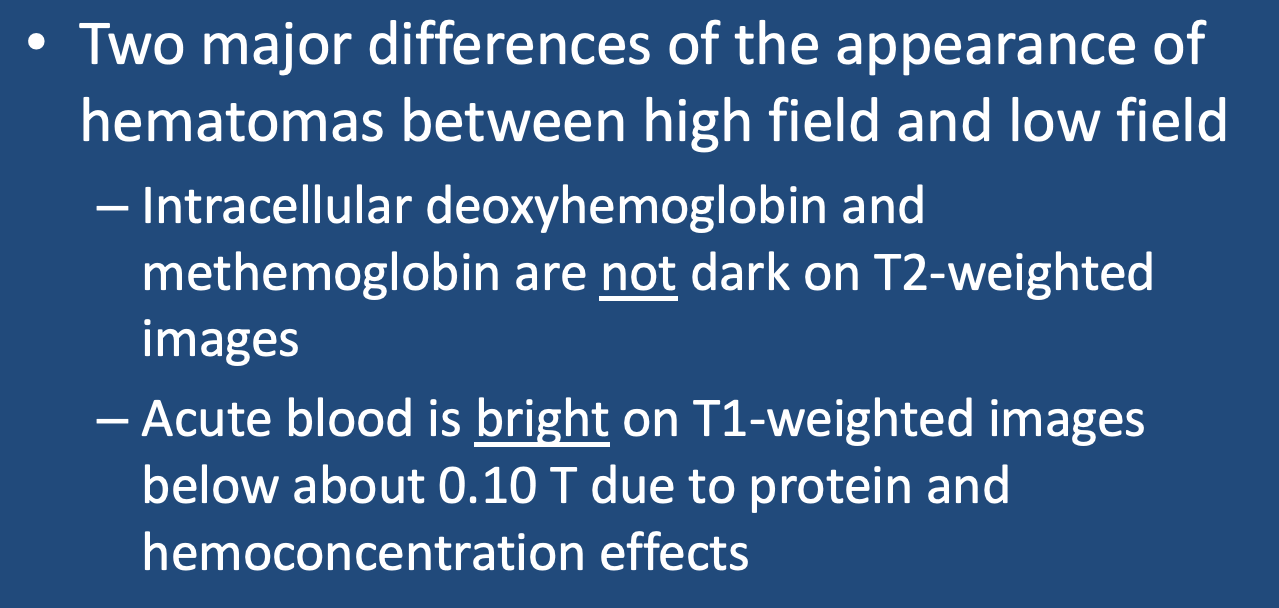
The previous Q&A's about hemorrhage primarily applied to higher field (≥ 0.5 T) systems where imaging findings are dominated by the paramagnetic effects of hemoglobin. At fields below 0.5 T, at least two major differences are noted:
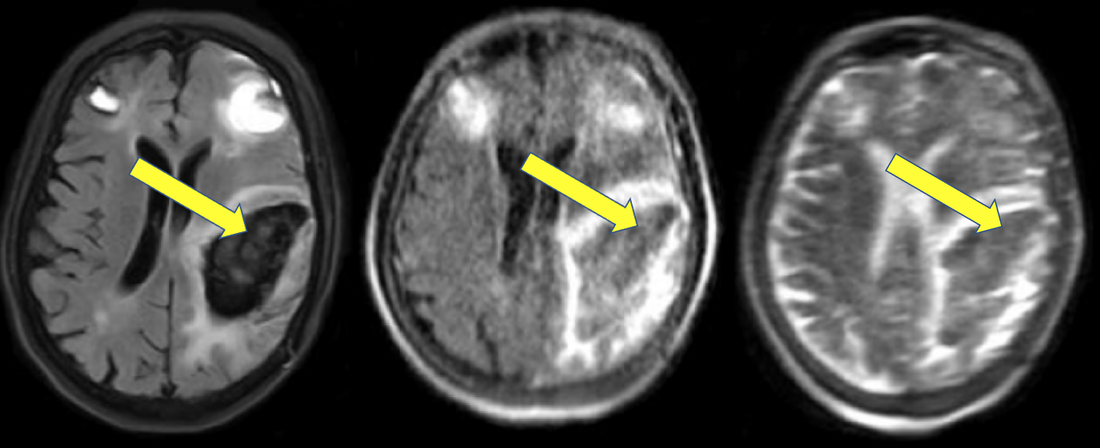
- The characteristic T2/T2* hypointensity of intracellular deoxyhemoglobin and methemoglobin seen at high fields is minimal or absent at low fields. Such hypointensity is due to susceptibility effects, which scale with the square of the magnetic field (Bo²). In going from 1.5T down to 0.15T, therefore, susceptibility effects are reduced by a factor of 100. The centers of acute and subacute hematomas are recognizable only by their shapes and a halo of surrounding edema, with signal intensities close to that of normal brain. The example below compares a hematoma imaged at 1.5T with two images obtained at 0.064T.

Acute hematoma imaged by T2-FLAIR at 1.5 T (left), showing markedly low central signal due to deoxyhemoglobin (arrow). T2-FLAIR (middle) and T2 (right) images obtained at 0.064T show the center of the hematoma to be relatively isointense to brain. It is still diagnosable as at hematoma when its shape and edematous margin is appreciated. (From Mazurek et al under CC-BY)
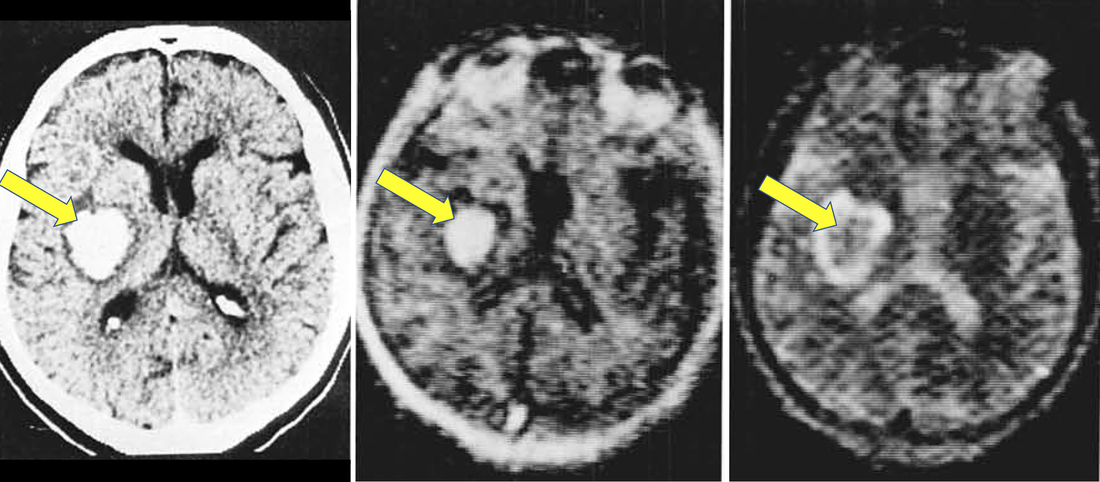
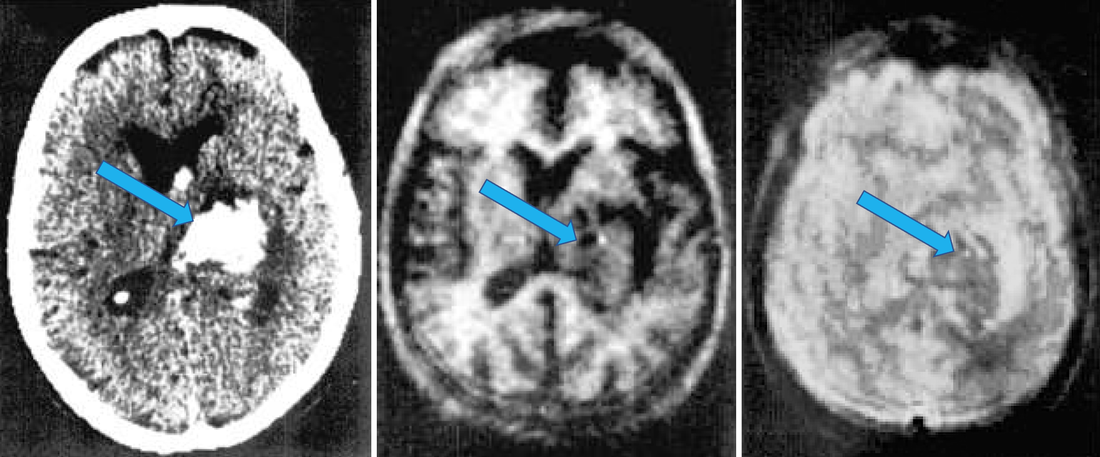
- At very low fields (below 0.10 T) in acute/subacute hematomas a new finding, central T1-hyperintensity, occurs. This interesting observation, described nearly 40 years ago, has been largely overlooked as the world focused on high-field imaging. The T1-hyperintensity is thought to be the result of hemoconcentration and increased protein in the clot, a phenomenon replicated using in vitro models.
Other than these two differences, I am not aware of any other major variances in the appearance of hematomas between high and low-fields.
|
Methemoglobin will remain bright on T1-weighed images at low fields, because here the T1-shortening is due to a direct water-gadolinium inner sphere relaxation effect rather than susceptibility. I fully expect in the next few years much more information will be available concerning the low- and very low-field appearances and evolution of hemorrhage requiring this page to be frequently revised.
|
Advanced Discussion (show/hide)»
No supplementary material yet. Check back soon!
References
Brooks RA, Di Chiro G, Patronas N. MR imaging of cerebral hematomas at different field strengths: theory and applications. J Comput Assist Tomogr 1989; 13:194-206.
Di Chiro G, Brooks RA, Girton ME, et al. Sequential MR studies of intracerebral hematomas in monkeys. AJNR Am J Neuroradiol 1986; 7:193-199. (Study performed at 0.5 T)
Dooms GC, Uske A, Brant-Zawadski M, et al. Spin-echo MR imaging of intracranial hemorrhage. Neuroradiology 1986; 28:132-138. (study performed at 0.35 T)
Hayman LA, Taber KH, Ford JJ, Bryan RN. Mechanisms of MR signal alteration by acute intracerebral blood: old concepts and new theories. AJNR Am J Neuroradiol 1991;12:899-907.
Mazurek MH, Cahn BA, Yuen MM, et al. Portable, bedside, low-field magnetic resonance imaging for evaluation of intracerebral hemorrhage. Nat Commun 2021; 12:5119. (Study performed at 0.064 T) [DOI LINK]
Sipponen JT, Sepponen RE, Sivula A. Nuclear magnetic resonance (NMR) imaging of intracerebral hemorrhage in the acute and resolving phases. J Comput Assist Tomogr 1983; 7:954-959. (Study performed at 0.17 T).
Sipponen JT, Sepponen RE, Tanttu JI, Sivula A. Intracranial hematomas studied by MR imaging at 0.17 and 0.02 T. J Comput Assist Tomogr 1985; 9:698-704.
Zimmerman RD, Heier LA, Snow RB, et al. Acute intracranial hemorrhage: intensity changes on sequential MR Scans at 0.5T. AJR Am J Roentgenol 1988; 150:651-661.
Zyed A, Hayman LA, Bryan RN. MR imaging of intracerebral blood: diversity the temporal pattern at 0.5 and 1.0T. AJNR Am J Neuroradiol 1991; 12:469-474.
Related Questions
What are the different forms of hemoglobin and why do they have different magnetic properties?
What are the different forms of hemoglobin and why do they have different magnetic properties?


