Up until now the MR signal has been treated rather informally, appearing as just a "squiggle" in most of our diagrams. For simplicity, I have purposely neglected dissecting the MR signal in detail. . . until now.
|
In prior Q&A's we illustrated how the MR signal is an electrical current induced in a receiver coil following stimulation of a spin system by an RF-pulse. The recorded signal from such a pulse experiment has the form of either a free induction decay (FID) or echo. Both types of signals are high frequency oscillations at the Larmor frequency, whose amplitudes rise or fall as a result of T2 effects and magnetic field inhomogeneities. In our simple examples we tacitly considered the MR signals to have arisen from a single large voxel in a homogeneous sample without spatial encoding.
|
The signals in MR imaging arise from multiple voxels, often from an entire slice (or slab of tissue containing many slices) recorded all at once. These voxels contain different materials with different spin densities and relaxation times. Furthermore, the main magnetic field (Bo) has often been purposely distorted by the use of gradients to change the frequency and phase of protons as a function of spatial position. The resulting total MR signal is thus the sum of thousands of FIDs and echoes arising from individual voxels with different amplitudes, frequencies, and phases.
Sorting out this huge array of overlapping and interfering signals might seem impossible, but a number of very clever techniques have been developed to do just that. Such methods (discussed in a later Q&A) include frequency-encoding, phase-encoding, variations of signal timing, and exploiting knowledge of coil location and sensitivity. Fourier transform methods also allow the data to be sorted out according to differences in frequency and accumulated phase.
|
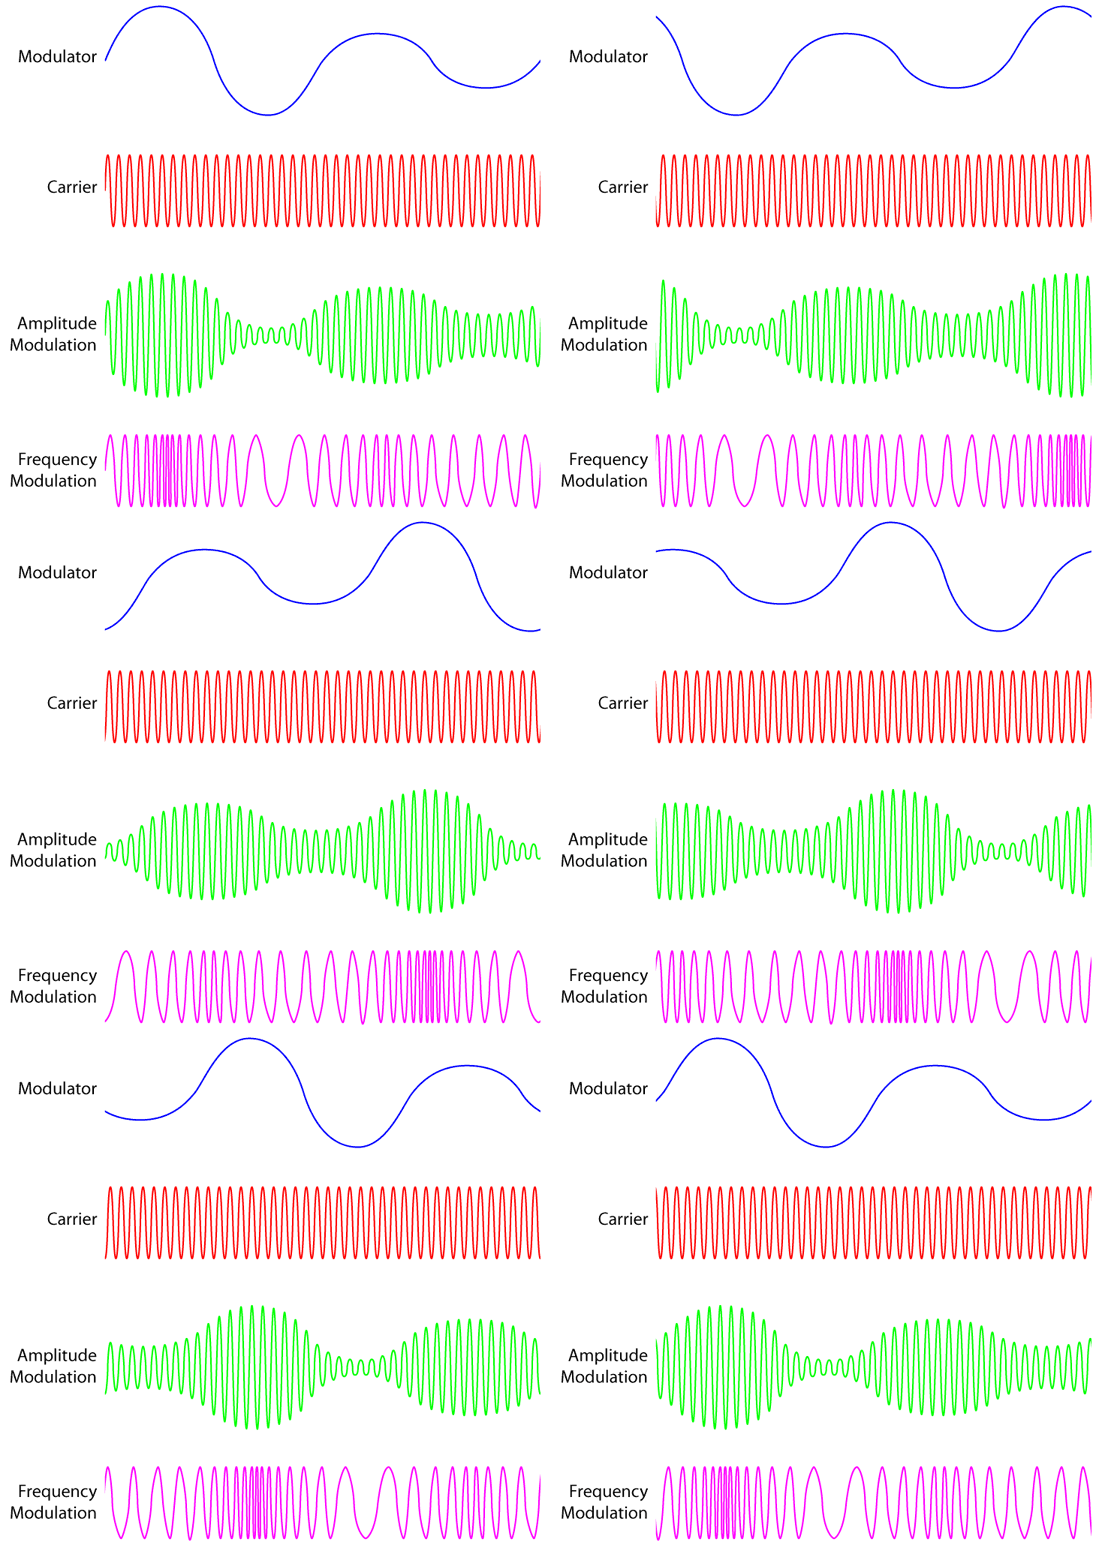
Although the baseline frequency of the MR signal is very high (~64 MHz for a 1.5T scanner), the vital spatial, spectral, and relaxation information is encoded over a much smaller range, typically less than 50-100 kHz. The baseline oscillation near the Larmor frequency acts only as a carrier wave for the much lower frequency imaging information, equivalent to the way commercial radio signals are transmitted. AM stations use amplitude modulation, where the amplitude of the carrier changes with with sound level. FM stations use frequency modulation, where wave spacing encodes the audio information. Phase modulation of the MR signal also occurs and is closely related to frequency modulation.
|
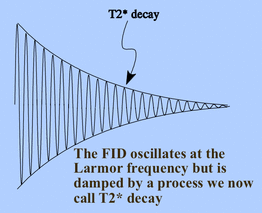
The FID pictured at the top of this Q&A is an example of a simple, amplitude modulated wave. It is composed of a carrier of the form { sin ωot } modulated by a decaying exponential e−t/T2*.
At a relatively early stage of MR signal processing, the high frequency carrier waves are filtered out, a process known as demodulation. This removal of the high frequency information doesn't solve the problem of figuring out what signal comes from where, but it does make the situation more manageable. After demodulation, we only need to decode spatial and spectral information where the frequencies lie in the range of a few thousand Hz (rather than across millions of Hz).
Advanced Discussion (show/hide)»
No supplementary material yet. Check back soon!
Related Questions
What is a free induction decay (FID)?
How does the scanner know the locations of all the MR signals?
What is a free induction decay (FID)?
How does the scanner know the locations of all the MR signals?


