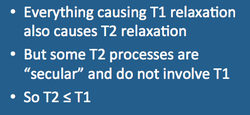
As described in a previous Q&A, T2 relaxation occurs whenever there is T1 relaxation. Some additional processes also exist (such as static local fields and spin "flip-flops") that cause T2 relaxation without affecting T1. T2 relaxation always proceeds at a faster rate than T1 relaxation; thus the the T1 relaxation time is always longer than or equal to T2.
|
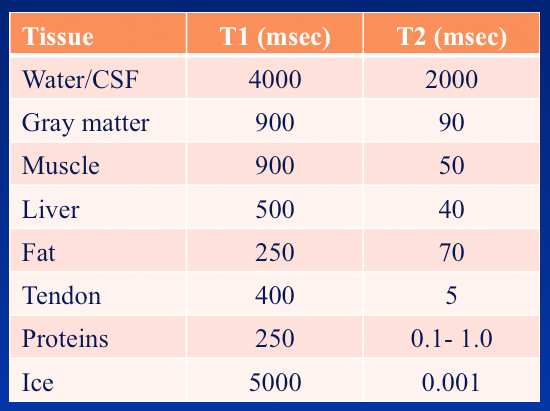
To the left is a table listing T1 and T2 values for hydrogen nuclei in various biological tissues. In lectures I generally show this chart to my students and ask them to identify the trends they see. I expect them to make at least three observations: 1) that for most organs T1 values are typically about 5-10x longer than T2 values; 2) that pure liquids (water/CSF) have very long T1 and T2 values; and 3) that dense solids (ice, tendons, and proteins) have very short T2 values.
|
|
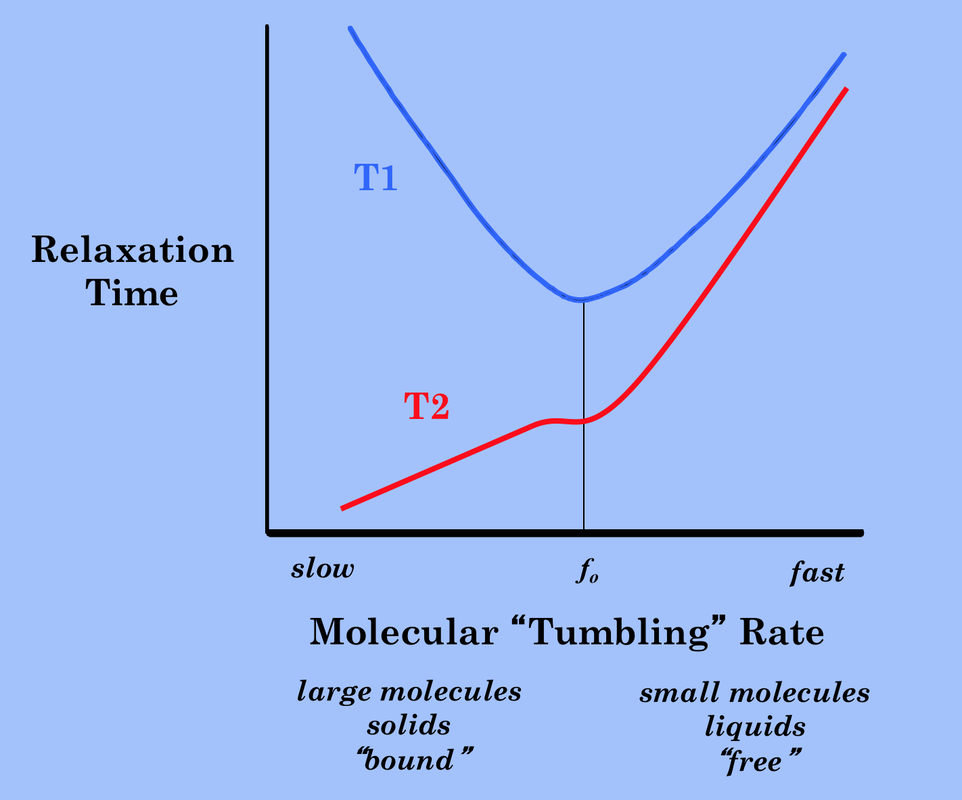
In future Q&A's you will gain a more quantitative understanding of why various tissues and substances have these particular T1 and T2 values. For now suffice it to say that the most important determinant is the size and motion of the molecule on which the hydrogen nucleus resides. This can be appreciated in the graph right showing T1 and T2 relaxation times plotted as a function of molecular "tumbling" rate. Small, rapidly rotating molecules (like free water) have long T1 and T2 times. As molecular motion slows (as in proteins and dense solids), T2 shortens and T1 again increases.
|
Advanced Discussion (show/hide)»
As referenced in the article by Traficante below, it is possible in extremely rare cases to construct molecular systems (often at low temperatures coupled to quantum baths) where T2 is slightly greater than T1. This occurs when spin relaxation is produced by fluctuating microscopic fields that are mostly transverse rather than longitudinal, often involving the antisymmetric components of the chemical shift tensor. For all practical purposes this never occurs outside of physics laboratories, so the reader may feel comfortable in the above explanation and assume T1 ≥ T2 always.
References
Bamaal DE, Lowe IJ. Proton spin-lattice relaxation in hexagonal ice. J Chem Phys 1968; 48:4614-4618.
Bojorquez JZ, Bricq S, Acquitter C et al. What are the normal relaxation times of tissues at 3 T? Magn Reson Imaging 2017; 35:69-80.
Bottomley PA, Foster TH, Argersinger RE, Pfeiffer LM. A review of normal tissue hydrogen NMR relaxation times and relaxation mechanisms from 1–100 MHz: Dependence on tissue type, NMR frequency, temperature, species, excision, and age. Med Phys 1984;11:425-448.
Koenig SH. Classes of hydration sites at protein-water interfaces: the source of contrast in magnetic resonance imaging. Biophysical J 1995; 69:593-603.
Stanisz GJ, Odrobina EE, Pun J et al. T1, T2 relaxation and magnetization transfer in tissue at 3T. Magn Reson Med 2005; 54:507-512.
Traficante DD. Relaxation. Can T2 be longer than T1? Concepts Magn Reson 1991; 3:171-177.


