- Translation of tissue MR signal s(t) into gadolinium concentration c(t);
- Selection of an appropriate arterial input function a(t); and
- Mathematical modeling and computation.
|
The first two steps have been described in prior Q&As. This section addresses mathematical methods to quantify blood flow knowing only c(t) and a(t). The analysis comes from from linear systems theory and requires several important assumptions:
|
The reader will immediately recognize how easily this simple model may fail in practice. For example, a brain tumor accumulating gadolinium contrast through a leaky blood-brain-barrier would not meet assumption #2. |

|
In real life it is impossible to deliver an
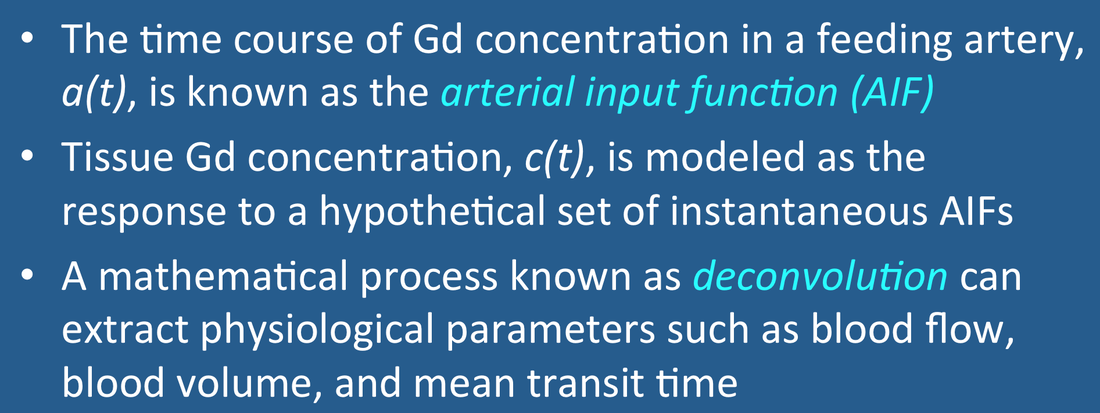
arterial bolus of contrast to tissue instantaneously. The arterial input function, a(t), is thus always dispersed in time as shown in the figure. This broad arterial input, however, can be represented as a set of Dirac delta functions at different time delays (τ), each producing an independent response. The mathematical operation of scaling and summing these individual impulse responses to generate the tissue contrast concentration curve c(t) is known as convolution. In mathematical notation
|
Josh Shimony: MRI Perfusion from NRG on Vimeo.
Advanced Discussion (show/hide)»
Fourier methods for deconvolution begin by taking the Fourier Transform (FT) of each side of the convolution equation for blood flow. This relies on the well-known Convolution Theorem that the Fourier Transform of a product of two functions is the convolution between the Fourier Transforms of each function. In mathematical terms
F • R(t) = FT−1{FT[c(t)] / FT[a(t)]}
Noting that the initial value of the residue function is 1 (i.e. R(0) = 1), the magnitude of the first time point of the solution equals blood flow (F). Although conceptually straightforward, this method is not frequently used because of instability and noise issues.
Many variations of the most popular technique, singular value decomposition (SVD) exist. SVD is a factorization method commonly used in matrix algebra to solve inverse problems. Because SVD is potentially ill-posed (unstable) due to round-off errors and noise, some constraints (regularization) must be applied. The most straightforward regularization method (truncation) treats all singular matrix values below a certain level as zeros. A second method (Tikhonov regularization) stabilizes the algorithm by manipulating the diagonal elements, resulting in a smoother truncation of singular values.
Another problem with the standard SVD method is that its results are sensitive to delays in contrast arrival between different parts of the tissue. Variations such as reformulated SVD and block-recirculant SVD largely overcome this limitation and are gradually being implemented by vendors in their software.
Several newer statistical methods focus more on improving estimations of the residue function and reducing its oscillations. Which method, if any, will prevail is not easily predictable at present
.
A number of clinical trials in the stroke literature have used a calculated perfusion metric known as Tmax. Tmax is defined to be the time at which the residue function, R(t), calculated from deconvolution, reaches its maximum value. In theory, therefore, Tmax is the time between the peak of the arterial input function (AIF) and the peak of the residue function.
Tmax is not the same as MTT. MTT reflects the transit of contrast through the capillary bed once it arrives at the tissue of interest. Conversely, Tmax reflects the time delay and dispersion of contrast between where the AIF is measured en route to the capillary system.
Tmax is thus highly dependent on the chosen location of the AIF. The farther away from the tissue of interest, the larger will be the Tmax value calculated. Additionally, regularization (filtering) of the SVD matrix to reduce noise effects in deconvolution will alter R(t) by inducing oscillations and peak shifting, also affecting Tmax.
Notwithstanding these methodological issues, many stroke neurologists seem to love Tmax and have recommended its use in a number of clinical trials. One reason I believe it is so favored is that Tmax maps display relatively "flat" image contrast in normal regions of brain but dramatic differences in regions with poor or marginal perfusion.
In summary, Tmax does provide some information that is complementary to MTT and CBF. However, it is a "messy" parameter that reflects primarily contrast delay and dispersion between the site chosen for AIF measurement and the tissue of interest. As such, it is very AIF-dependent and should be used with caution in comparing different patients in stroke research protocols.
Boxerman JL, Rosen BR, Weisskoff RM. Signal-to-noise analysis of cerebral blood volume maps from dynamic NMR imaging studies. J Magn Reson Imaging 1997; 7:528-37.
Calamante F, Christensen S, Desmond PM, et al. The physiological significance of the time-to-maximum (Tmax) parameter in perfusion MRI. Stroke 2010; 41:1169-1174. (See Advanced Discussion tab for why I don't favor this parameter in practice.)
Fieselmann A, Kowarschik M, Ganguly A, et al. Deconvolution-based CT and MR brain perfusion measurement: theoretical model revisited and practical implementation details. Int J Biomed Imag 2011; doi:10/1155/2011/467563
Orsingher L, Piccinini S, Crisi G. Differences in dynamic susceptibility contrast MR perfusion maps generated by different methods implemented in commercial software. J Comput Assist Tomogr 2014; 38:647-654. (different software gives different results, even when methods are said to be the same!)
Østergaard L, Weisskoff RM, Chesler DA, et al. High resolution measurement of cerebral blood flow using intravascular tracer bolus passages. Part I. Mathematical approach and statistical analysis. Magn Reson Med 1996; 36:715-725. (good description of deconvolution techniques including Fourier and SVD).
Zaharchuk G. Theoretical basis of hemodynamic MR imaging techniques to measure cerebral blood volume, cerebral blood flow, and permeability. AJNR Am J Neuroradiol 2007; 28:1850-8.
What is the arterial input function (AIF) and why do you need to measure it?
How are parameters like BF, BV, and MTT defined and used in perfusion imaging?


