The late subacute stage of hematoma evolution is generally considered to last between about 1 week and 2 months after the initial hemorrhage. By the end of the first week, lysis of red blood cells (RBCs) occurs with release of methemoglobin (met-Hb) into the hematoma cavity.
|
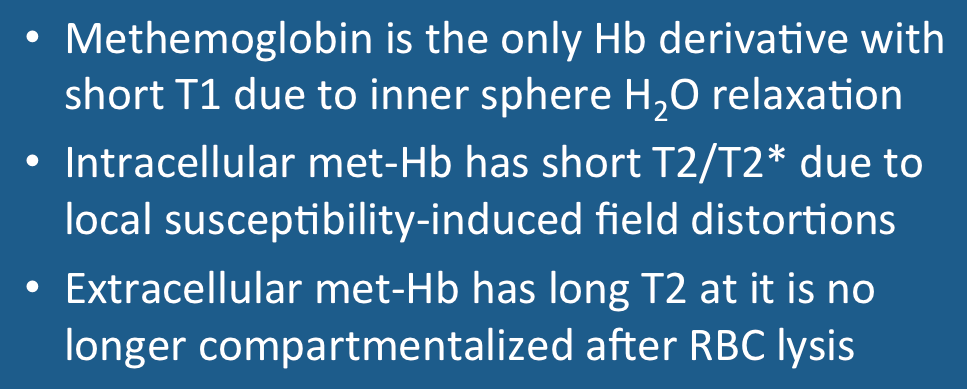
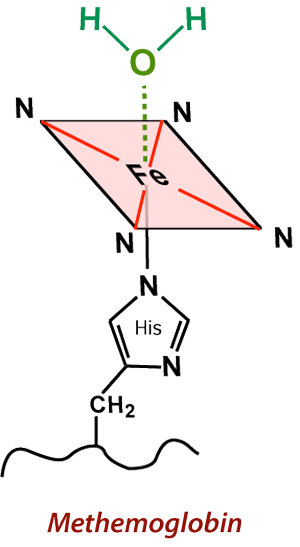
As described in a prior Q&A, met-Hb has 5 unpaired electrons and is highly paramagnetic. Additionally, the shape of the crevices within the globin subunits allows close approach of water molecules to the heme ferric (Fe+3) centers. The resulting complex is known as aquo-methemoglobin. The direct interaction of H2O molecules and heme centers results in inner sphere relaxation with very short T1 values (and corresponding brightness on T1-weighted images). As long as met-Hb continues to be compartmentalized intracellularly, however, local magnetic susceptibility effects persist and the hematoma remains dark on T2/T2*-weighted images. |
|
With lysis of RBCs methemoglobin is no longer concentrated into multiple intracellular compartments, but becomes uniformly dispersed throughout the hematoma cavity. There it is mixed/dissolved with water and residual serum components. Local T2/T2*-dephasing effects disappear and the hematoma now becomes bright on T2 weighted images.
|
Above: Imaging characteristics of late subacute hematomas (typical time frame, 1 week - 2 months). During this stage extracellular methemoglobin predominates in the center, with ferritin/hemosiderin deposited at the periphery.
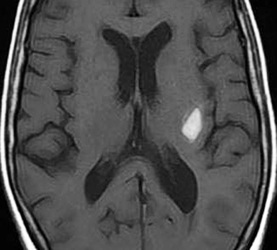
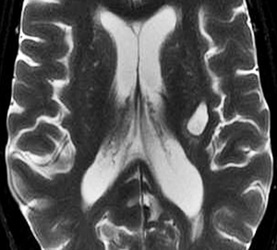
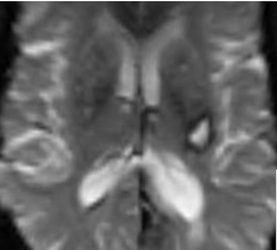
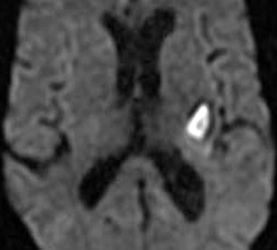
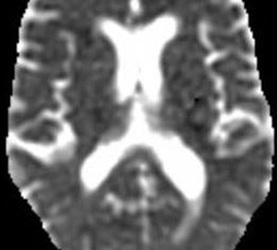
Below: MR images obtained about 3 weeks after left basal ganglia hemorrhage illustrating extracellular methemoglobin. Center of hematoma is hyperintense to brain on both T1-weighted (top left) and T2-weighted (top center) images. Center is also hyperintense on T2*-weighted gradient echo image (top right), with prominent low signal at periphery due to ferritin/hemosiderin deposition. Trace DW image (bottom left) shows high signal centrally, reflecting continued diffusion restriction within the increasingly liquified hematoma. Diffusion is indeed restricted compared to cerebrospinal fluid (CSF), but only minimally or not at all compared to brain. This can be noted on the ADC map (bottom center) where the center of the hematoma is isointense or even slightly higher intensity than brain. Thus the high signal on the trace/DWI image mostly represents a "T2-shine-through" effect rather than highly restricted diffusion. Note that both the DWI and ADC images have a dark peripheral ring due to susceptibility effects of ferritin/hemosiderin.
Below: MR images obtained about 3 weeks after left basal ganglia hemorrhage illustrating extracellular methemoglobin. Center of hematoma is hyperintense to brain on both T1-weighted (top left) and T2-weighted (top center) images. Center is also hyperintense on T2*-weighted gradient echo image (top right), with prominent low signal at periphery due to ferritin/hemosiderin deposition. Trace DW image (bottom left) shows high signal centrally, reflecting continued diffusion restriction within the increasingly liquified hematoma. Diffusion is indeed restricted compared to cerebrospinal fluid (CSF), but only minimally or not at all compared to brain. This can be noted on the ADC map (bottom center) where the center of the hematoma is isointense or even slightly higher intensity than brain. Thus the high signal on the trace/DWI image mostly represents a "T2-shine-through" effect rather than highly restricted diffusion. Note that both the DWI and ADC images have a dark peripheral ring due to susceptibility effects of ferritin/hemosiderin.
Important Note: The discussion above primarily applies to higher field (≥ 0.5 T) systems where imaging findings are dominated by the paramagnetic effects of hemoglobin. At low and intermediate fields some important differences in imaging appearances are noted. See this Q&A for a more detailed analysis.
Advanced Discussion (show/hide)»
No supplementary material yet. Check back soon!
References
Bass J, Sostman HD, Boyko O, Koepke JA. Effects of cell membrane disruption on the relaxation rates of blood clot with various methemoglobin concentrations. Invest Radiol 1990: 25:1232-7.
Bass J, Sostman HD, Boyko O, Koepke JA. Effects of cell membrane disruption on the relaxation rates of blood clot with various methemoglobin concentrations. Invest Radiol 1990: 25:1232-7.
Related Questions
What are the different forms of hemoglobin and why do they have different magnetic properties?
What is T2 shine-through?
Why is methemoglobin bright on T1-weighted images?
What happens after the met-Hb stage and how do these later degradation products affect the MR signal?
What are the different forms of hemoglobin and why do they have different magnetic properties?
What is T2 shine-through?
Why is methemoglobin bright on T1-weighted images?
What happens after the met-Hb stage and how do these later degradation products affect the MR signal?
