Voxel size is the primary determinant of signal-to-noise (SNR) in both MRI and MRS. The effect is direct and linear: a voxel twice as large as another will have twice the SNR. In MRS the size of each peak is roughly proportional to the number of protons giving rise to that peak, so if the vertical axis remains a fixed dimension we would expect all peaks to become taller as voxel volume increases.
Advanced Discussion (show/hide)»
Then number of excitations (NEX) for spectral signal averaging is generally a power of 2 (e.g., 2, 8, 64, 128). As with conventional imaging, higher values of NEX improve signal-to-noise and reduce motion artifacts. With multiple excitations, further improvement can be obtained through the use of phase cycling.
As a simple example of phase cycling, consider a NEX=2 study where the phase of the RF-pulse for the second acquisition is inverted relative to that used in the first acquisition. This process produces an inversion of the recorded signal between the two acquisitions. The second (inverted signal) is then subtracted from the first, resulting in a net addition of the two signals while cancelling out RF errors independent of the fixed phase shift.
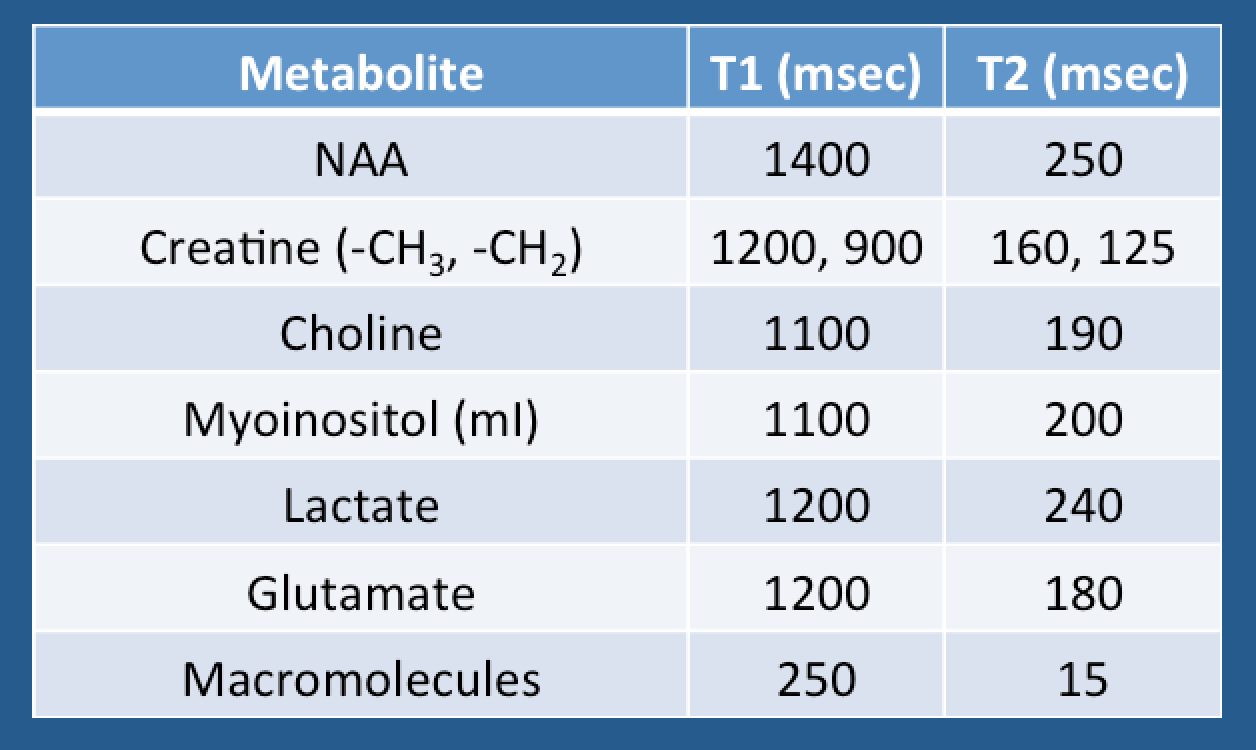
The actual range of measured metabolite T1s and T2s is quite large among different studies, sometimes varying as much as ± 30% from the average values cited. There can be appreciable differences among brain regions as well. A strong field dependence is also noted, with T2 values at 7T much shorter than those at 3T in the table.
Bertoldo D, Watcharakorn A, Castillo M. Brain proton magnetic resonance spectroscopy. Introduction and overview. Neuroimag Clin N Am 2013; 23:359-380.
Govindaraju V, Young K, Maudsley AA. Proton NMR chemical shifts and coupling constants for brain metabolites. NMR Biomed 2000; 13:129-153. (Extensive tables, spectra, and descriptions for just about every metabolite ever detected on a brain MRS study).
Li Y, Ozturk-Isik E, Lupo JM, et al. T1 and T2 metabolite relaxation times in normal brain at 3T and 7T. J Mol Imaging Dynam 2012, S1-5.
Posse S, Otazo R, Dager SR, Alger J. MR spectroscopic imaging: principles and recent advances. J Magn Reson Imaging 2013; 37:1301-1325.
Träber F, Block W, Lamerichs R, et al. ¹H metabolite relaxation times at 3.0 Tesla: Measurements of T1 and T2 values in normal brain and determination of regional differences in transverse relaxation. J Magn Reson Imaging 2004; 19:537-545.
Zhu H, Barker PB. MR spectroscopy and spectroscopic imaging of the brain. Methods Mol Biol 2011; 711:203-226.
Are stimulated echoes used for imaging? I've never heard of that.
What is a stimulated echo?
How does PRESS differ from STEAM? Which should I use for MRS?


