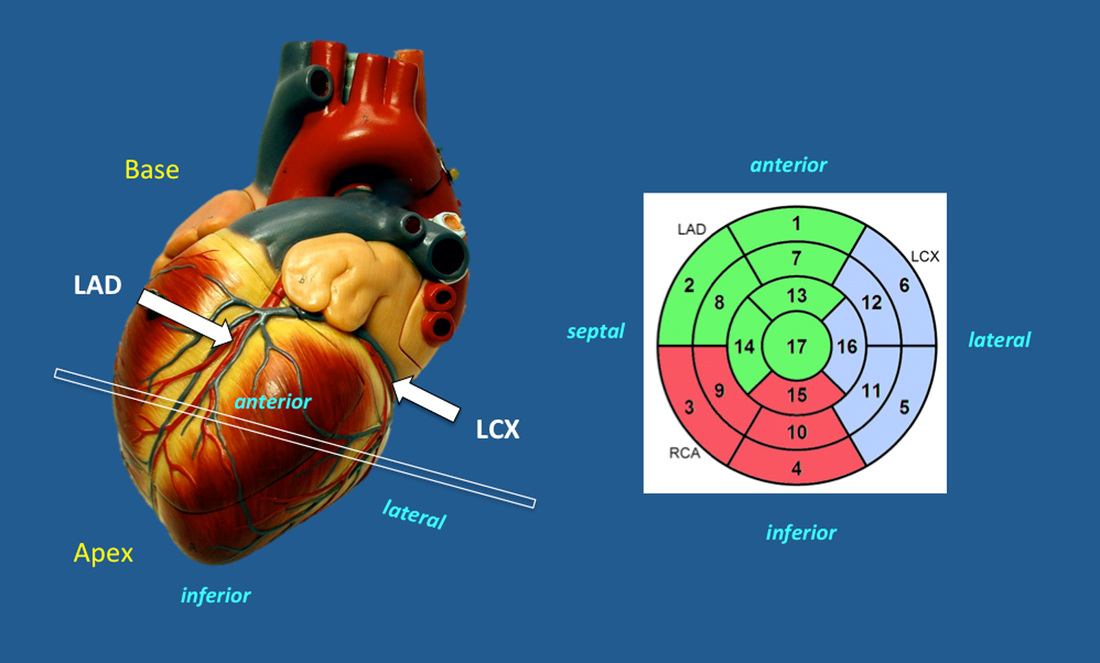
The circular plots you are referring to are maps of cardiac function superimposed on the American Heart Association's (AHA) standard 17-Segment Model of left-ventricular anatomy. The graphs are commonly referred to as "polar", "target", or "bulls-eye" plots.
The plots are constructed of concentric rings stacked together as shown in the diagram below. Each ring corresponds to a short-axis (SAX) section through the left ventricle. The largest (outer) ring is at the cardiac base; the second ring is at mid-cavity; the third (and smallest) ring is near the cardiac apex. The center of the "bulls-eye" represents the apical cap at the extreme tip of the ventricle where a cavity is no longer present.
Because the heart lies obliquely in the chest, short-axis sections do not correspond precisely to the cardinal anatomic directions defined for the entire human body, resulting in a slightly different terminology. Instead of right and left, the sides of each circular section are denoted septal and lateral. Likewise, the top and bottom of each myocardial ring are denoted anterior and inferior respectively.
The basal and mid-cavity rings are divided into six segments each subtending arcs of 60°, numbered 1−6 and 7−12 respectively. The numbers begin anteriorly and proceed in a counterclockwise fashion around each ring. Due to its smaller size the apical ring is assigned only four segments (13−16), while the apical cap is denoted #17.
|
|
Bulls-eye plots are commonly employed to display various aspects of cardiac function, such as % wall thickening between systole and diastole or myocardial perfusion. This provides a rapid visual aid for assessing abnormalities and comparing sequential studies over time. Similar plots are also used in nuclear cardiology.
|
Advanced Discussion (show/hide)»
No supplementary material yet. Check back soon!
References
Cerqueria MD, Weissman NJ, Dilsizian V, et al. AHA Scientific Statement. Standardized myocardial segmentation and nomenclature for tomographic imaging of the heart. Circulation 2002; 105;539-542.
Ortiz-Pérez JT, Rodriguez J, Meyers S, et al. Correspondence between the 17-segment model and coronary arterial anatomy using contrast-enhanced cardiac magnetic resonance imaging. J Am Coll Cardiol Img. 2008; 1:282-293. (Good paper showing variable distribution of coronary artery supply to different heart segments as opposed to the idealized AHA model above).
Related Questions
How is ejection fraction computed using cine MRI?
How is ejection fraction computed using cine MRI?


